
Are We on the edge of a recession?
The simple answer to this question based on economic macro data and market indexes is a straightforward 'yes' as we predicted earlier this year and as confirmed by the analysis of David Hay below. But the more complex answer is that our financial system is now leveraged to the point that Central Banks cannot allow a recession to take place less we start our descent into a depression.
So what happens next?
This article is based on a market research recently published on Zero Hedge which can be found through the link below:
https://www.zerohedge.com/markets/deja-vu-2000-or-flashback-2007-part-2
Authored by David Hay via Evergreen Gavekal blog,
and partly copied for its most relevant aspects after the article.
and partly copied for its most relevant aspects after the article.
In the short term, nothing much above the waterline. Volatility will stay high and markets will go nowhere. That is until the prophetic black swan strikes and exposes the gigantic financial house of cards we have constructed over the last 20 years. But below the waterline, we are already in crisis management. In the US, the Fed will not repeat the mistake of 2008 and is ready to flood the market with liquidity on short notice as was displayed last week in the Repo market.
Japan has been in this "zombie economy" state for the last 30 years. In and out of recession every other month while it's economy shrank from 18% of the world economy in 1994 to just above 5% now! This process has been imperceptible in Tokyo where growth is concentrated but devastating the further away from the capital you go with smaller local cities shrinking into nonexistence especially on the Japan sea coast, Tohoku and Shikoku areas.
Europe has been more contrasted although the financial dislocation has been deeper lately with negative rates affecting most countries. The damage of these rates cannot be overstated as government debt crowds out investment and therefore growth in the long term as surely as in Japan.
What is left now to avoid a global recession is the American consumer and the Chinese investment bubble. The later has been slowing down markedly over the last 2 years with the trade dispute intensifying and the former leveraged to the hilt is heading towards a rather gloomy year-end.
So however you look at it, the recession that cannot happen less we find that everyone was swimming naked is approaching fast. Massaging employment figures and other macro-economic data has become a habit nowadays with hedonistic adjustment skillfully added to minimize inflation and employment data that a communist apparatchik could second guess months in advance. (They are then restated with real data a year later, usually lower but by then who cares!)
What Central Banks have discovered over the years is not financial wisdom in managing carefully money creation but that economic cycles are mostly amplified by psychological factors and that consequently to avoid panics, the back-mirrors indexes on which they focus must stay bright whatever the road ahead, which they have few tools to assess, looks like.
And here we are at the end of 2019, on the edge of the precipice, with shrinking international trade, 75% of the most important interest rates in Europe negative, an inverted yield curve in the US which means that you should stay as liquid as possible and invest 'another day', waiting for a black swan, hoping that an approaching election is the US will prevent a maverick president to rock the boat and that anyway should 'anything' happen, The Fed, ECB, BOJ and BOC will know what to do! Good luck with that!
Today, people are concerned with global warming and other long term social issues. In a year of so, economic priorities will be on top of their list once again. Did you say Paradigm Shift?
Update 23 Sep 2019
Korea is one of the earliest country to publish its trade data every month.
These are 'real' numbers unlike other composite 'estimates' like employment and they are not pretty! We are probably already in a recession!
-
Exports to China -29.8%;
-
Exports to U.S. -20.7%;
- Export to EU -12.9%;
-
Exports to Japan -13.5%


Deja-Vu 2000 Or Flashback 2007? (Part-2)
“The experience in Japan, Europe, or even the US, is that
once you get into a near-zero interest-rate regime, it’s kind of a black hole.
The economy tends to be pulled in, and once there, it’s difficult to escape.” -
Larry Summers, former US Secretary of the Treasury.
“The US economy is in far worse shape than the Q2 GDP
data suggest. Only the consumer is preventing a recession at the moment, and
that is only happening because of stepped-up credit usage and a corresponding
dip in the savings rate.” - David Rosenberg.
“The best signal of a recession is not an inverted yield
curve. It’s the inversion occurring and then going away.” - DoubleLine Funds
lead portfolio manager, Jeffrey Gundlach
SUMMARY
- Evidence, such as the yield curve inversion, is mounting that later this year, or in the first half of 2020, the US could find itself in the midst of a recession.
- However, it’s fair to note that not all US recession indicator warnings are lit up.
- The planet’s banks are facing a trifecta of troubles from zero and sub-zero rates, generally inverted yield curves, and tight credit spreads.
- The eradication of interest rates is also the kiss of death for insurance companies, pension plans, and retired investors.
- In our view, a window of opportunity has opened up with certain high-yield equities that are in out-of-favor industries.
DÉJÀ VU 2000 OR FLASHBACK 2007? (PART II)
Let’s return to one of the most pressing questions facing
investors right now, one we also discussed last week: Namely, how probable is a
recession this year or next? The renowned David Rosenberg, who was one of the
handful of economists to predict the 2007 downturn, thinks the US may be in one
now. Evergreen doubts that, but the evidence is mounting that perhaps later
this year, or in the first half of 2020, we could be in the midst of one (a
topic I’ll return to at the close of this “Bubble 3.0” chapter).
Moreover, just this week the man considered the new King
of Bonds, Jeff Gundlach, made the bold call that he believes there is a 75%
chance of a US recession prior to next year’s presidential election. This is
despite a growing chorus in the financial media lately singing the tune that
the global economy is reviving. (Presumably, per his quote at the top of page
1, the reason he believes an “un-inversion” is problematic is that these happen
when the Fed is panicking and furiously cutting rates to stave off a
recession.)
Again, returning to the inversion of the yield curve, a
striking aspect is how virtually the entire curve is flipped, which is a rare
occurrence. As David Rosenberg wrote two weeks ago in his daily Breakfast
with Dave (a must read, in my opinion, for any serious investor),
the Fed pays the most attention to the 3-month T-bill versus the 10-year
T-note. As well they should; when that has stayed inverted for at least
three straight months, a recession has occurred 100% of the time. Guess what just
happened?

As David wrote on August 26th, “When it (the curve) was
only flattening a year ago, the bulls said ‘it’ll never invert.’ When it began
to, the bulls said “only 2s/10s matter.’* When that inverted, the bulls said,
‘it’s different this time’. Good grief.”
Senior Fed officials have been right in there with the
no-worries consensus on the inverted yield curve but at least one of them is
breaking with their complacent ranks. St. Louis Fed-head James Bullard recently
insisted that our central bank’s main priority should be normalizing the yield
curve. He added that he has no interest in hearing any of his colleagues’
rationalizations about why this time is different, perhaps because he’s laser-focused
on the chart above showing the 3-month/10-year inversion.
As David Rosenberg further wrote in his 8/26 Breakfast
with Dave missive, “…the reality is that it is a very rare
circumstance when the ENTIRE yield curve is inverted from the Fed funds to the
30-year Treasury bond…So we have 50 years’ worth of data and nine periods where
the entire yield curve…inverted. I’m sure it’s always different to some, but of
these nine episodes (where a full inversion occurred), we had eight recessions
to follow.”
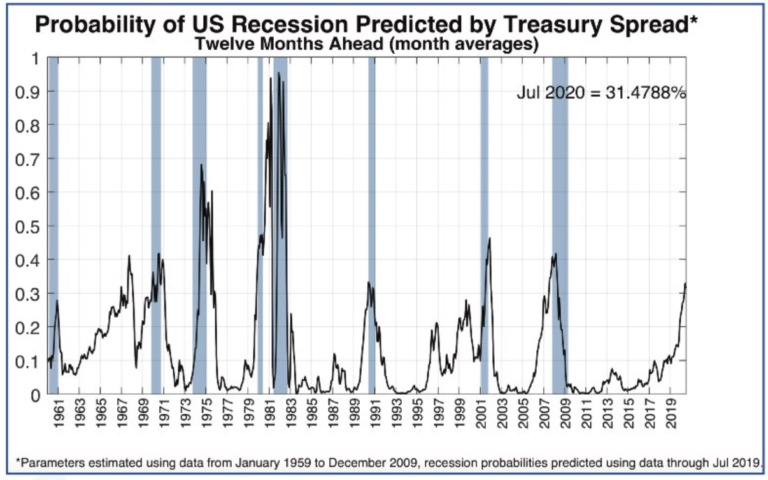
Similarly, my great friend Grant Williams recently wrote
that the New York Fed’s treasury spread monitor has had a flawless recession
forecasting record since 1960. This is most ironic since the Fed itself has
missed every one, not just over the last 60 years but going all the way back to
the end of WWII.

Source: Things That Make You Go Hmmm
As you likely surmised, the New York Fed’s indicator is
strictly a function of the yield curve. Consequently, James (No Bull) Bullard’s
appraisal on the urgency of normalizing the yield curve is certainly logical.
The way in which the Fed would try to get the curve
uninverted is to slash interest rates fast and hard. It might also seek to
“twist” the yield curve, as it has done in the past, by selling longer term
securities (thereby driving their prices down and yields up) and buying shorter
maturities (pushing their rates down).
*The inversion of the 2-year vs the 10-year treasury
notes.
Regardless, the majority of commentators continue to diss
the yield curve’s message. Frankly, I would have more sympathy for this view if
it wasn’t for the swelling body of evidence indicating this expansion is close
to fork-sticking time. Past EVAs have often discussed the
Chicago National Activity Index because it is the broadest of all US economic
measures, consisting of 85 different components. This index has eroded in seven
of the past eight months. This isn’t proof-positive of a looming contraction
but it’s a serious alarm bell. Additionally, the closely-watched US
ISM (Institute of Supply Management) manufacturing index was reported earlier
this month and it was a dismal 49.1 (below 50 signifies contraction). Worse
yet, the forward-looking New Orders sub-index was a very weak 47.2.
The stock market is clearly sniffing this out. The
cyclical elements of the S&P 500 were recently down 17% from their peak
levels, not far from actual bear market territory, defined as falling more than
20% from a zenith point. (This week has seen a partial reversal of this
decline.)
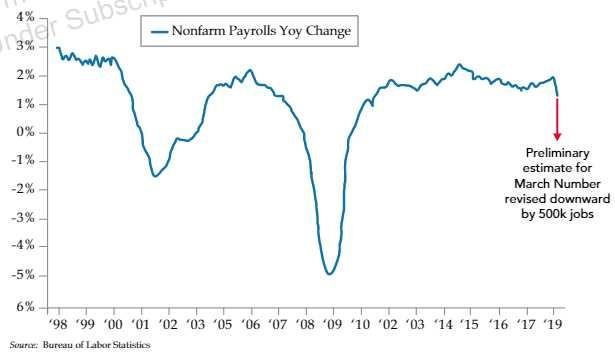
As we’ve often noted in these pages, the shining star of
this expansion has been the jobs market. But as we’ve also been observing in
earlier EVAs, labor market conditions are fraying. Lately, that’s
turned into an outright rip. The Bureau of Labor Statistics recently announced
a 500,000-job downward revision through this past March.
Make Job Creation Great Again

Source: Bureau of Labor Statistics, Danielle DiMartino
Booth
Speaking of revisions, and returning to the earnings
theme, there was a recent momentous recalculation by the government that has
received little notice outside of these pages, Charles Schwab’s Liz Ann
Sonders, David Rosenberg and another friend of mine, Danielle DiMartino Booth. This
revision had the effect of erasing all pre-tax profit growth for Corporate
America back to—are you ready for this—year-end 2011.
For some reason, when the perma-bulls briefly concede
this point, they invariably say since 2016. While that’s technically true, what
they fail to mention is that the earlier earnings recession in 2015 brought
profits back to where they were at the end of 2011. Note that this is on a
pre-tax basis for both public and private companies, so it excludes the steroid
effect of the Trump corporate tax cut and also the ultimate
performance-enhancing drug of share buy-backs. There’s little doubt that the
Fed’s eight-year suppression of interest rates, before it belatedly tried to
raise them back to “normal”, was the great enabler of the stock repurchase
mania. (Note that it was only able to raise up to 2 3/8% on the fed funds rate
before the market started cracking; this is the first time since the 1930s, by
the way, that such a miniscule interest level caused a stock market seizure.)
It’s fair to note that not all US recession indicator
warnings are lit up. The
Index of Leading Economic Indicators (LEIs) still looks reasonably robust, as
does consumer spending (though the latter has been goosed lately by rising
borrowings and falling savings). Moreover, credit spreads (the yield difference
between US government and corporate bonds) remain tight. These often begin to
widen materially before serious economic and market dislocations occur.
However, in last year’s traumatic fourth quarter, credit spreads seemed to
follow the stock market rather than lead it, a most unusual development.
But there might be another message from both the yield
curve and credit spreads that the never-say-die crowd is missing. In a
recent riveting interview, Donald Amstad of Aberdeen
Standard makes the critical point that the banking industry’s profitability is
driven by three key factors: high interest rates (at least well above zero),
steep yield curves (deposit rates low and further-out lending rates well above
those), and wide credit spreads (because banks are essentially spread
investors, borrowing at near government bond rates and lending out, usually, at
higher yields to at least somewhat risky borrowers, like companies and
consumers).
Consequently, the planet’s banks are facing a trifecta of
troubles from zero and sub-zero rates, generally inverted yield curves, and
tight credit spreads.
Undoubtedly, those profit-sucking factors are why European bank stocks recently
broke below their global financial crisis lows. Think about that for a moment:
eurozone banking shares hit a lower low last month than was seen during the
worst financial panic since the Great Depression.

Source: Bloomberg, Evergreen Gavekal
It’s not a lot better in the rest of the developed world,
even in the US which, at least for now, still has positive interest rates,
notwithstanding the inverted yield curve in the States. The chart of American
banks looks a lot better than their European counterparts but it’s not great.
And neither is the trading pattern of Japan’s banking sector.

Source: Bloomberg, Evergreen Gavekal
Of course, as noted in prior EVAs, the eradication of
interest rates is also the kiss of death for insurance companies, pension
plans, and the retired, or soon to be, investor class, a point vehemently made
in last month’s Guest EVA, “The Disaster of Negative Interest Policy”. John
Maynard Keynes, the progenitor of both Keynesian economics and the term
“euthanasia of the rentier*” must be grinning from ear-to-ear these days from
wherever his soul resides. The mega-problem, though, is that it’s nearly
impossible to have a healthy economy without a healthy banking system.
As we know, minimal to non-existent interest rates have
done the double prop-up duty of pushing older investors into stocks (more to
follow on this shortly) and providing corporations with cheap financing with
which to repurchase their own shares. These are certainly two key reasons why the S&P 500
has been remarkably resilient despite a long and growing list of risks, some of
the mega-variety (like the escalating trade war). This is why US stocks trade
at one of the most generous multiples of overall corporate earnings ever seen,
outside of the last few years of the tech bubble.
Stocks Very High Verses Overall Corporate Profits

Source: Ned Davis Research, August 28th, 2019
*Rentier is a synonym, in this case, for lender or
investor.
Despite the big downward revision to pre-tax profits,
after-tax earnings per share remain quite lofty, though they are clearly
eroding. Thus, the US stock market is elevated even compared to what are likely
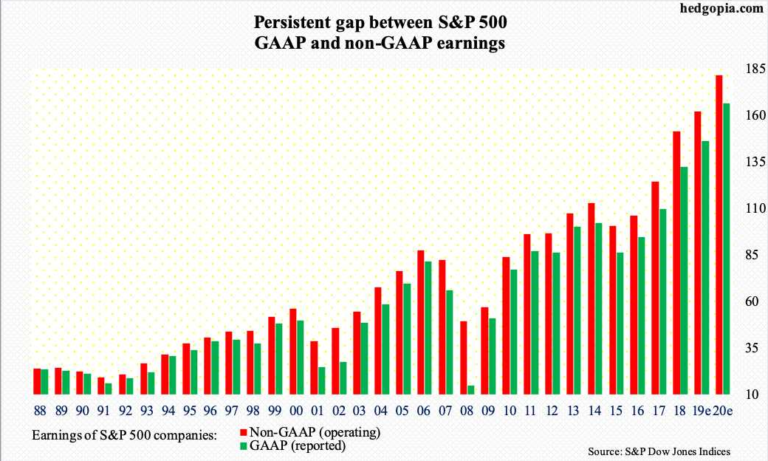
to be top-of-the-cycle profits. In addition to the recent profits downshift,
the following chart from my friend Paban Pandey in his always interesting Hedgopia service shows
the growing gap (sorry) between GAAP (Generally Accepted Accounting Principle
earnings) and non-GAAP (earnings minus all the bad stuff companies want you to
ignore). This growing differential is a classic sign the end is
nigh for this particular profits bull market.
Note that the GAAP/Non-GAAP comparison really gapped
(there I go again) in 2007 right before the Great Recession. In fact, on a
percentage basis that one year was worse than any seen recently. However, the
persistence of the wide differential since 2016 is noteworthy. On a cumulative
basis, the spread between fact and fiction appears to be the greatest ever seen
prior to the onset of a recession and bear market over the last 30 years. Yet,
how often do you hear about this in the mainstream financial media? How about
almost never.
Once again, though, the market may have picked up the
scent. The S&P has risen just 5% from where it was in January of 2018,
despite this week’s rally (which, fortunately, has been led by the undervalued
part of the two-tier market we’ve been talking about). Coincidentally, I began
this “Bubble 3.0” series a month earlier, in December, 2017. The main focus of
my ire at the time was the biggest bubble in human history: Bitcoin and the
other crypto currencies. Since then, we’ve had a series of other bubbles such
as in pot stocks like Tilray, US new issues (IPOs), and allegedly high-growth
momentum stocks.
The rest of the article is less relevant to our point and can be found on:
or
https://www.zerohedge.com/markets/deja-vu-2000-or-flashback-2007-part-2


No comments:
Post a Comment