This article reminds me of a funny Canadian joke of a decade ago where for the weather forecast they predict -10C for the next 9 days and +1C for the 10th day to keep hope alive!
Here, it's the exact opposite, they predict "A Substantial Chance Of A Major Financial Collapse" (in the future) whereas the numbers show that it's already happening in slow motion. Declining energy consumption cannot be interpreted any other way: The West is past its peak and energy is now too expensive to be used effectively. (Declining return on investment) Cheap imports from China mostly, have been hiding this fact for almost a decade but no longer now that the decline is accelerating in absolute terms.
I can still remember British historians highlighting in the 1980s the incontrovertible fact that the West was already in decline then, something which was still far from obvious at the time. Later understanding that social and economic decline are tightly intertwined and seeing in Japan the ever so slow slide downward post bubble, the process became clearer.
A financial collapse WILL happen. It is the unavoidable consequence of excess money printing and more generally, fiat currency, meaning based on no assets whatsoever. The money is creating liabilities but not enough assets to cancel the debt which will therefore have to be forfeited. Monetary authorities understand this perfectly and will therefore push toward a conflict to avoid taking responsibility for the crash. With this in mind, the tensions with Russia, Iran and China are easier to understand. No compromise will be accepted. Surrender and be quartered the Iraq way or accept a conflict which the West needs to justify restructuring of their financial system. There is simply no viable alternative to this dark scenario.
Authored by Gail Tverberg via Our Finite World,
Moving industrialization offshore can look like a good idea at first. But as fossil fuel energy supplies deplete, this strategy works less well. Countries doing the mining and manufacturing may be less interested in trading. Also, the broken supply lines of 2020 and 2021 showed that transferring major industries offshore could lead to empty shelves in stores, plus unhappy customers.
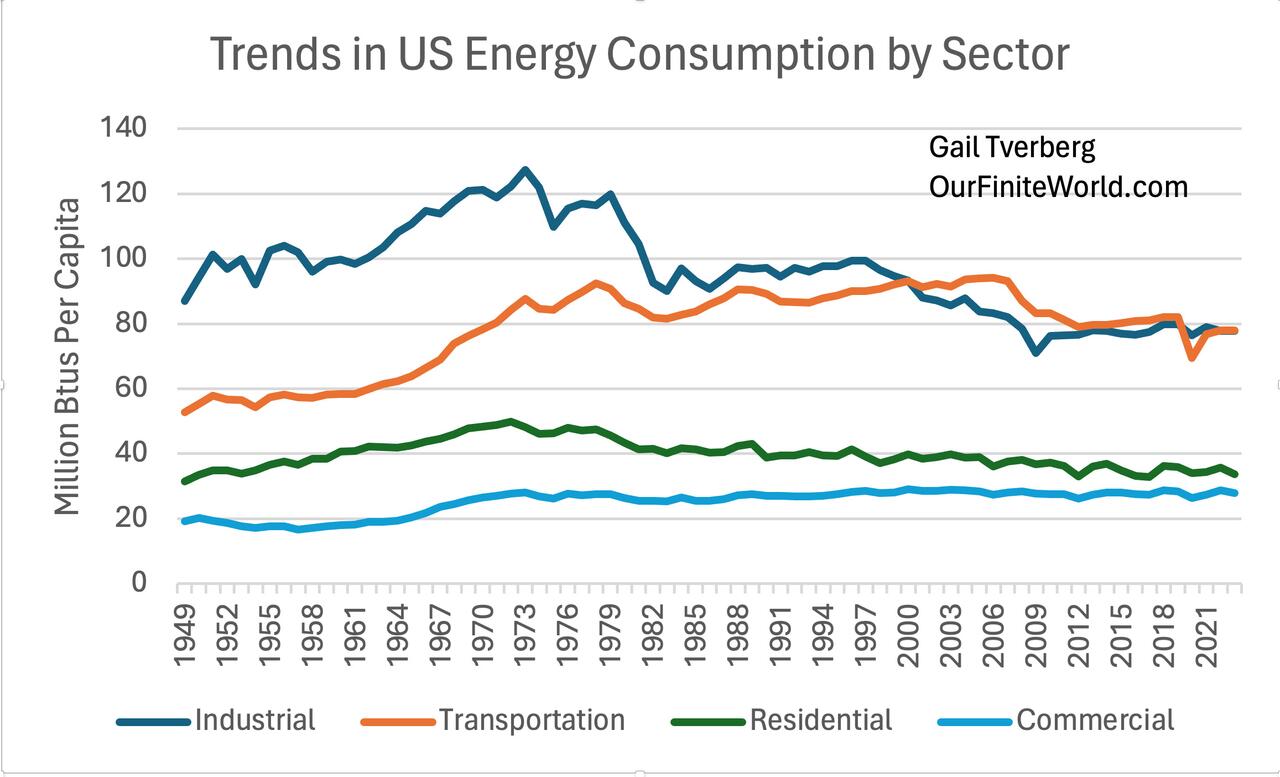
The United States started moving industry offshore in 1974 (Figure 1) in response to spiking oil prices in 1973-1974 (Figure 2).
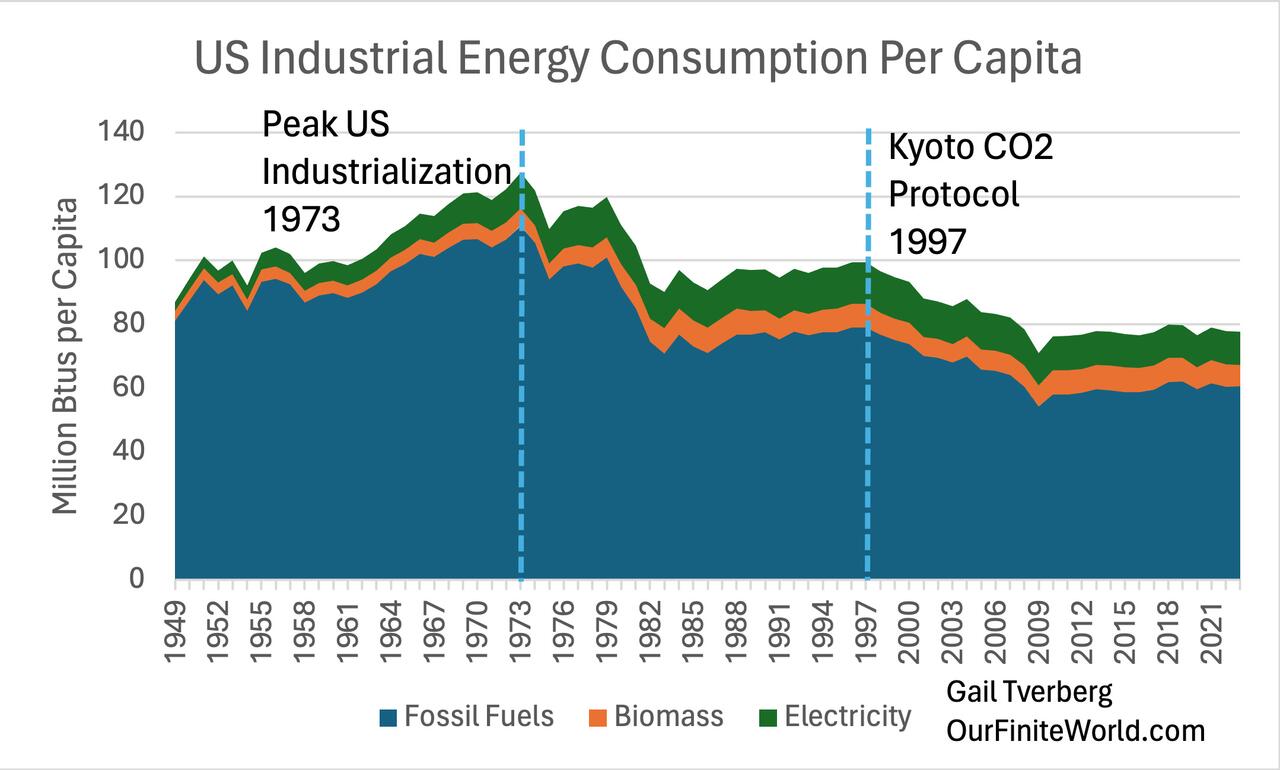
Industry is based on the use of fossil fuels. Electricity also plays a role, but it is more like the icing on the cake than the basis of industrial production. Industry is polluting in many ways, so it was an “easy sell” to move industry offshore. But now the United States is realizing that it needs to re-industrialize. At the same time, we are being told about the need to transition the entire economy to electricity to prevent climate change.
In this post, I will try to explain the situation–how fossil fuel prices have spiked many times, including 1973-1974 (oil) and more recently (coal in 2022). I will also discuss the key role fossil fuels play. Because of the key role of fossil fuels, a reduction in per-capita fossil fuel consumption likely leads to a transition to fewer goods and services, on average, per person. A transition to all electricity does not seem to be feasible. Instead, we seem to be headed for increased geopolitical conflict and the possibility of a financial crash seems greater.
[1] When fossil fuel supplies become constrained, prices tend to spike to high levels, and then fall back again.
Economists and energy analysts have tended to assume that fossil fuel prices would rise to very high levels, allowing extraction of huge amounts of difficult-to-extract fossil fuels. For example, the International Energy Agency (IEA) in the past has shown forecasts of future oil production assuming that inflation-adjusted oil prices will rise to $300 per barrel.
Instead of rising to a very high level, fossil fuel prices tend to spike because there is a two-way contest between the price the consumers can afford and the price the sellers need to keep reinvesting in new fields to keep fossil fuel supplies increasing. Prices oscillate back and forth, with neither buyers nor sellers finding themselves very happy with the situation. The current price of the benchmark, Brent oil, is $81.
[2] Historical data shows spiking oil and coal prices.
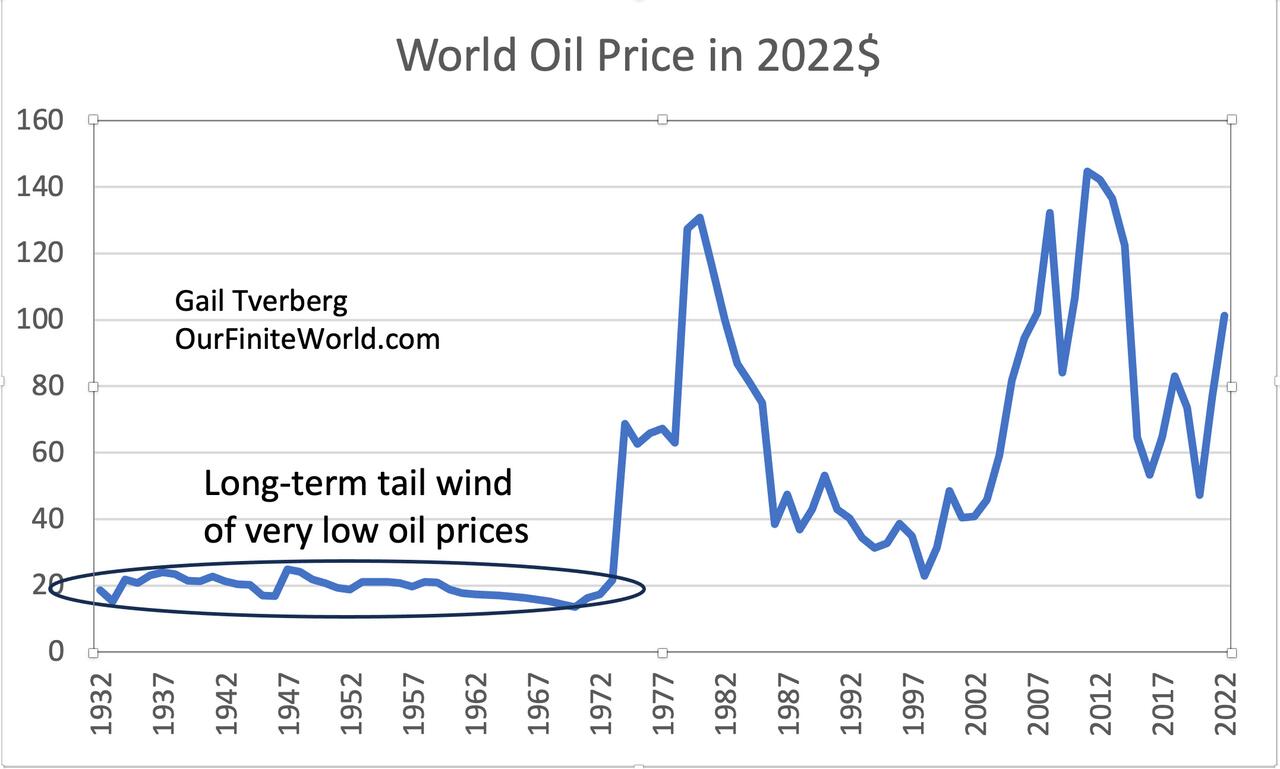
When world oil prices started to spike in the 1973-1974 period, the US started to move its industrial production offshore (Figure 1). The very low inflation-adjusted prices that prevailed up until 1972 no longer held. Manufacturing costs climbed higher. Consumers wanted smaller, more fuel-efficient vehicles, and such cars were already being manufactured both in Europe and in Japan. Importing these cars made sense.
More recently, coal prices have begun to spike. Coal prices vary by location, but the general patterns are similar for the types of coal shown.
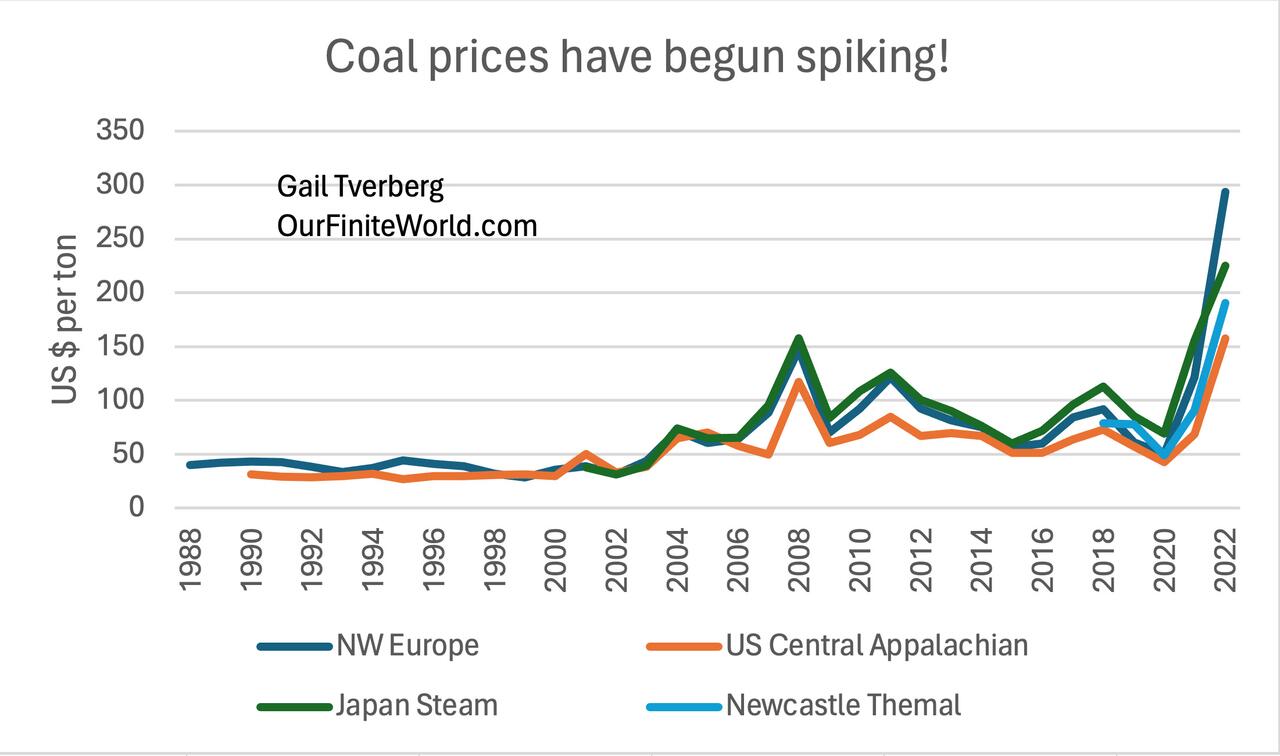
Before China joined the World Trade Organization (WTO) in 2001, coal prices tended to be below $50 per ton (figure 3). At that price, coal was a very inexpensive fuel for making steel and concrete, and for many other industrial uses.
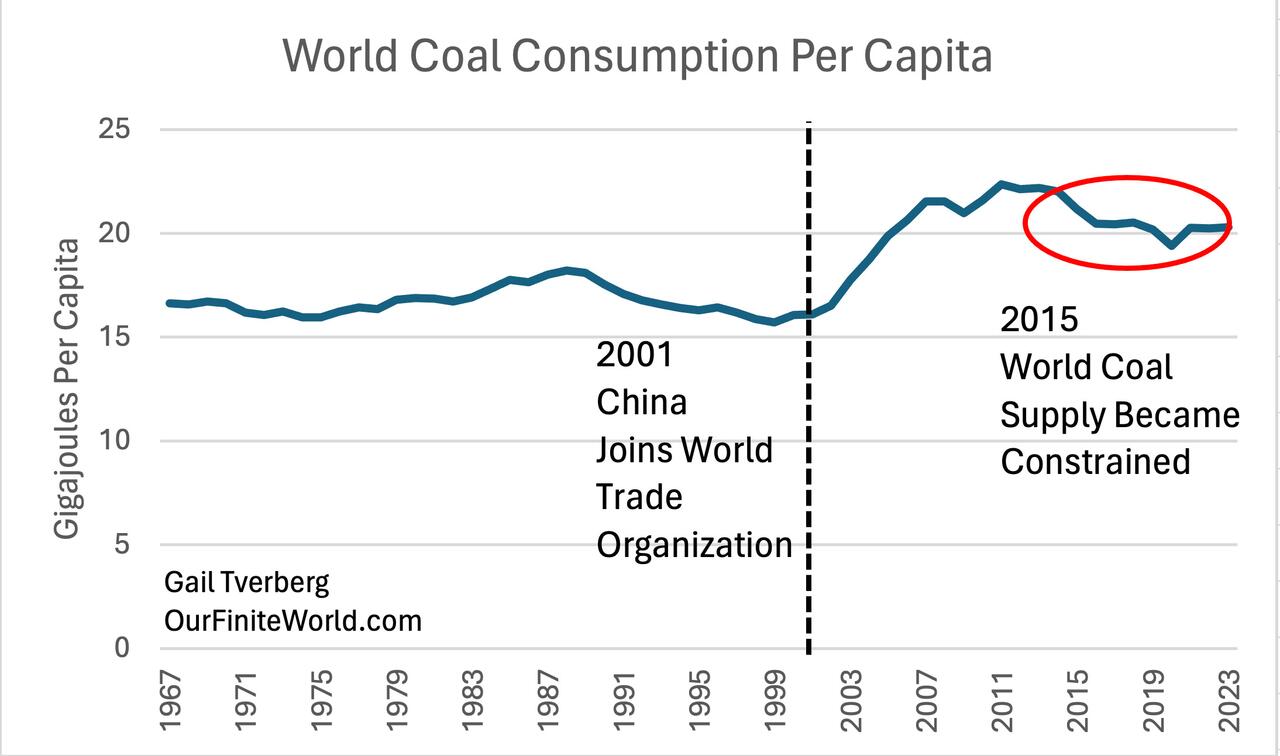
After China joined the WTO, China’s coal consumption soared (Figure 4), allowing it to industrialize. Figure 3 shows that the extra demand initially pushed coal prices up a little. By 2022, coal prices had soared. At present, coal prices are part-way back down, perhaps partly because higher interest rates are dampening world demand for coal.
Natural gas prices also soared in 2022, at the same time as coal prices. Both coal and natural gas are fuels that are burned to produce electricity. When the coal supply is constrained, utilities will try to purchase more electricity produced by burning natural gas. However, it is difficult to store much natural gas for future use. Thus, a shortage of internationally traded coal can simultaneously lead to a shortage of internationally traded natural gas.
Having oil, coal, and natural gas prices spiking at the same time leads to inflation and to many unhappy citizens.
[3] The 1997 Kyoto Protocol encouraged the trend toward moving industry to lower-cost countries.
In Figure 1, I show a dotted line at 1997. At that time, an international treaty stating that the participating countries would limit their own CO2 emissions attracted a lot of attention. An easy way to limit CO2 emissions was by moving industry overseas. Even though the US did not sign the treaty until later, the treaty gave the US a reason to move industry overseas. We can see from Figure 1 that US industrialization, as measured by the energy per capita required to industrialize, began to fall even more rapidly after 1997.
[4] There were many reasons besides the Kyoto Protocol why Advanced Economies would want to move industry overseas.
There were many reasons to move industry overseas besides spiking oil prices and concern over CO2 levels. With such a change, customers in the US (and European countries making a similar change) gained access to lower-cost goods and services. With the money the customers could save, they were able to buy more discretionary goods and services, which helped to ramp up local economies.
Also, industry tends to be polluting. Smog tends to be problem if coal is burned, or if diesel with high sulfur content is burned. Mining tends to produce a lot of toxic waste. Moving this pollution offshore to poorer countries would solve the pollution problem without the high cost of attempting to capture this pollution and properly store it.
Furthermore, business-owners in the United States could sense the opportunity to grow to be truly international in size if they moved much of their industry overseas.
[5] All the globalization and moving of industry overseas had a downside: more wage and wealth disparity.
In a matter of a few years, the economy changed to provide fewer high-paying factory jobs in the United States. Increasingly, those without advanced education found it difficult to provide an adequate living for their families. The high incomes were disproportionately going to highly educated workers and the owners of capital goods (Figure 5).
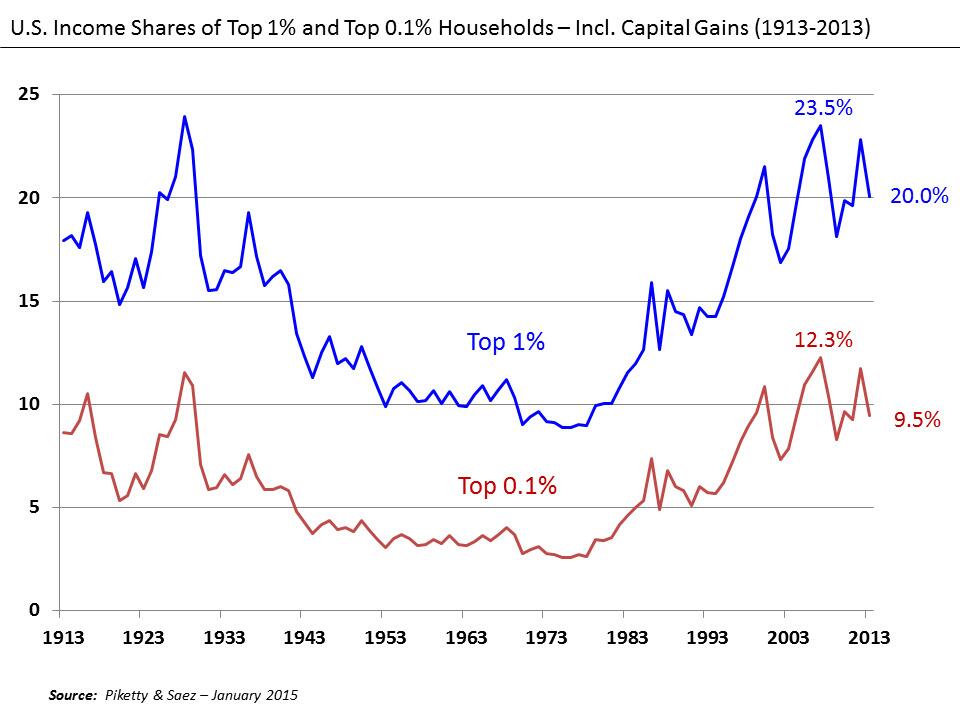
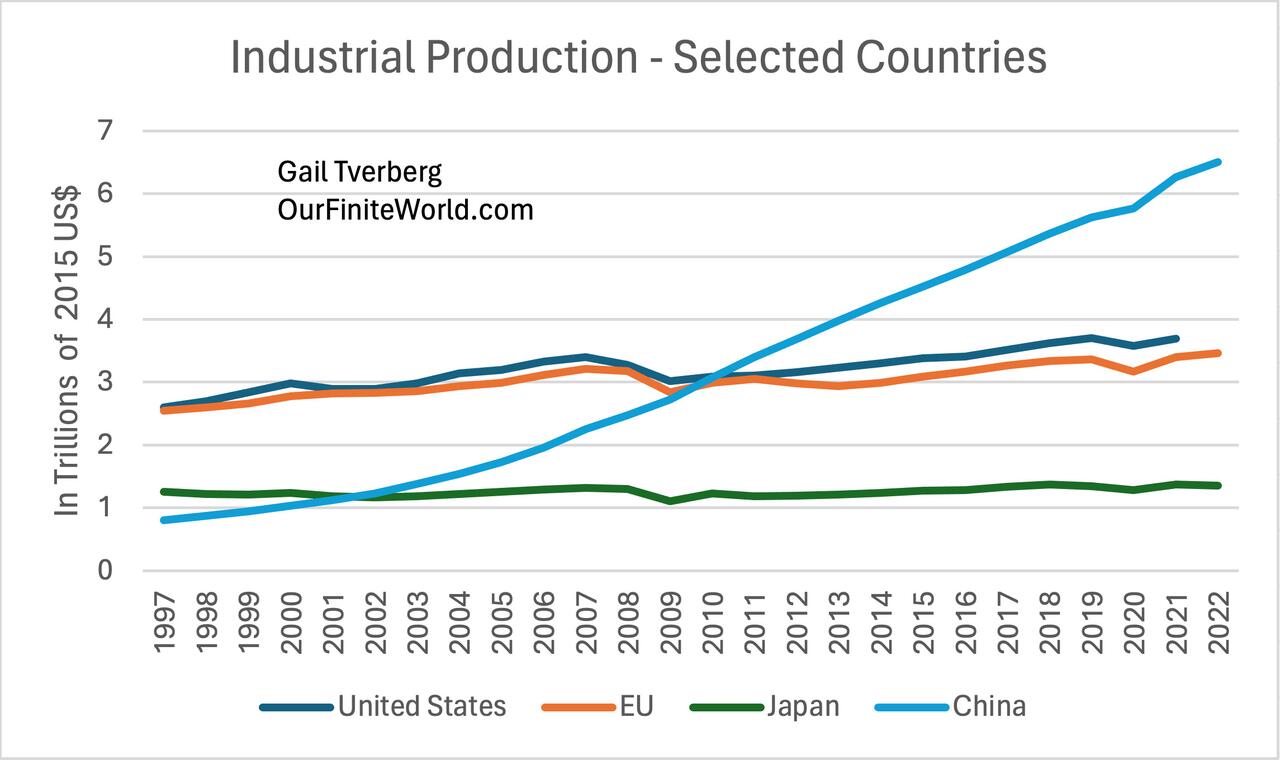
[6] Part of what caused the growing wage and wealth disparities in Figure 5 was the growing industrialization of China (Figure 6).
China, with its growing industrialization, could outcompete whole industries, such as furniture-making and garment-making, leaving US workers to find lower-paid jobs in the service sector. Similar outcomes unfolded in the EU and Japan, as industrialization started moving to different parts of the world.
[7] The indirect impact of the Kyoto Protocol was to move CO2 emissions slightly away from the Advanced Nations. Overall, CO2 emissions rose.
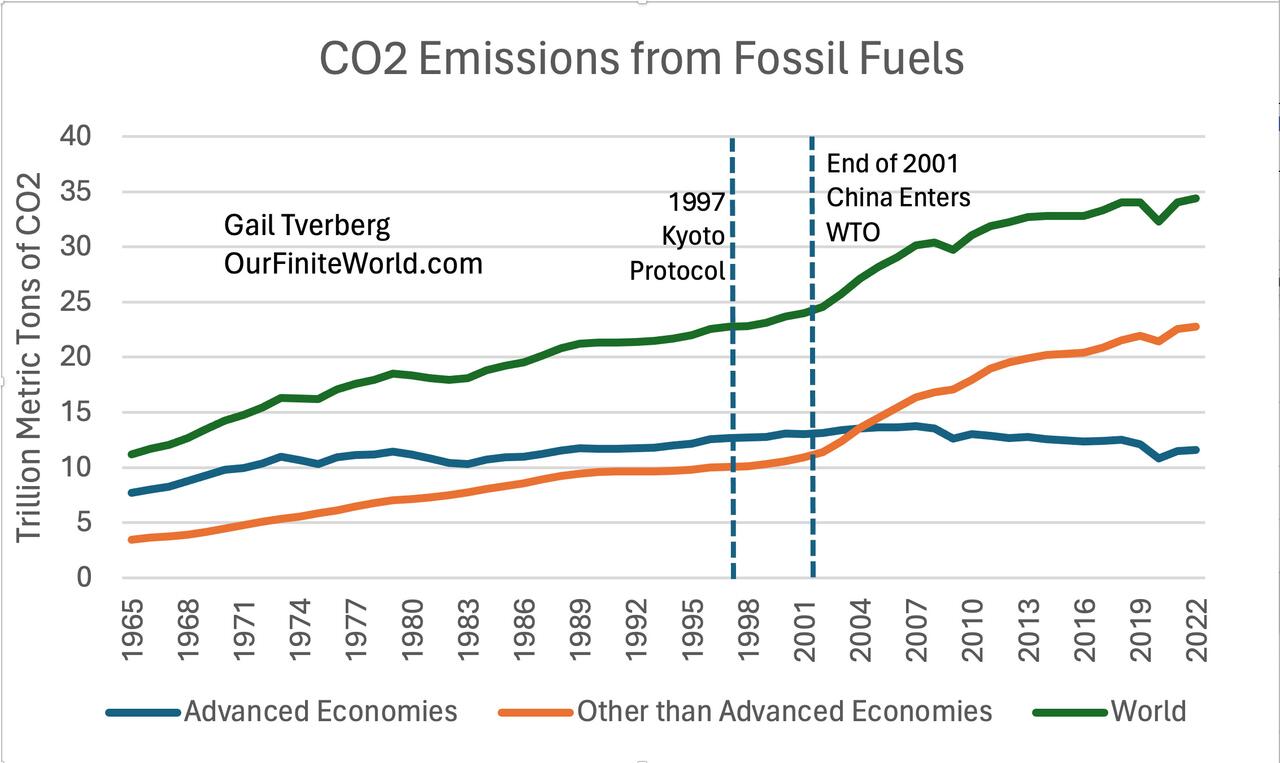
Anyone who expected that the 1997 Kyoto Protocol would reduce world CO2 emissions would have been disappointed.
[8] The direct use of fossil fuels plays a far more important role in the economy than we have ever been taught.
Thanks to the direct use of fossil fuels, the world can have paved roads, bridges made of steel, and electricity transmission lines. It can have concrete. It can have pharmaceutical products, herbicides, and insecticides. Many of these benefits come from the chemical properties of fossil fuels. Electricity, by itself, could never provide these products since it has been stripped of the chemical benefits of fossil fuels. Electricity is also difficult to store.
With the benefit of fossil fuels, the world can also have high-quality steel, with precisely the composition desired by those making it. With only electricity, it is possible to use electric arc furnaces to recycle used steel, but such steel is limited both in quantity and quality. US production of steel amounts to 5% of world supply (primarily using electric arc furnaces), while China’s production (mostly using coal) amounts to 50% of world supply.
I highly recommend reading the article, Trapped in the Iron Age, by Kris De Decker. He explains that the world uses an enormous amount of steel, but most of it is hidden in places we can’t see. Today, with the US’s limited steel-making capability, the US needs to import most of its steel, including steel pipes from China to drill its oil wells. We cannot see how dependent we have become on other countries for our basic steel needs.
China and India have both based their recent growth primarily on rising coal consumption. This is what has kept world CO2 emissions high. The US is now exporting coal to these countries.
[9] Citizens of Advanced Economies are easily confused about the importance of fossil fuel use because they have never been taught about the subject and because their worldview is distorted by the narrow view they see from within their homes and offices.
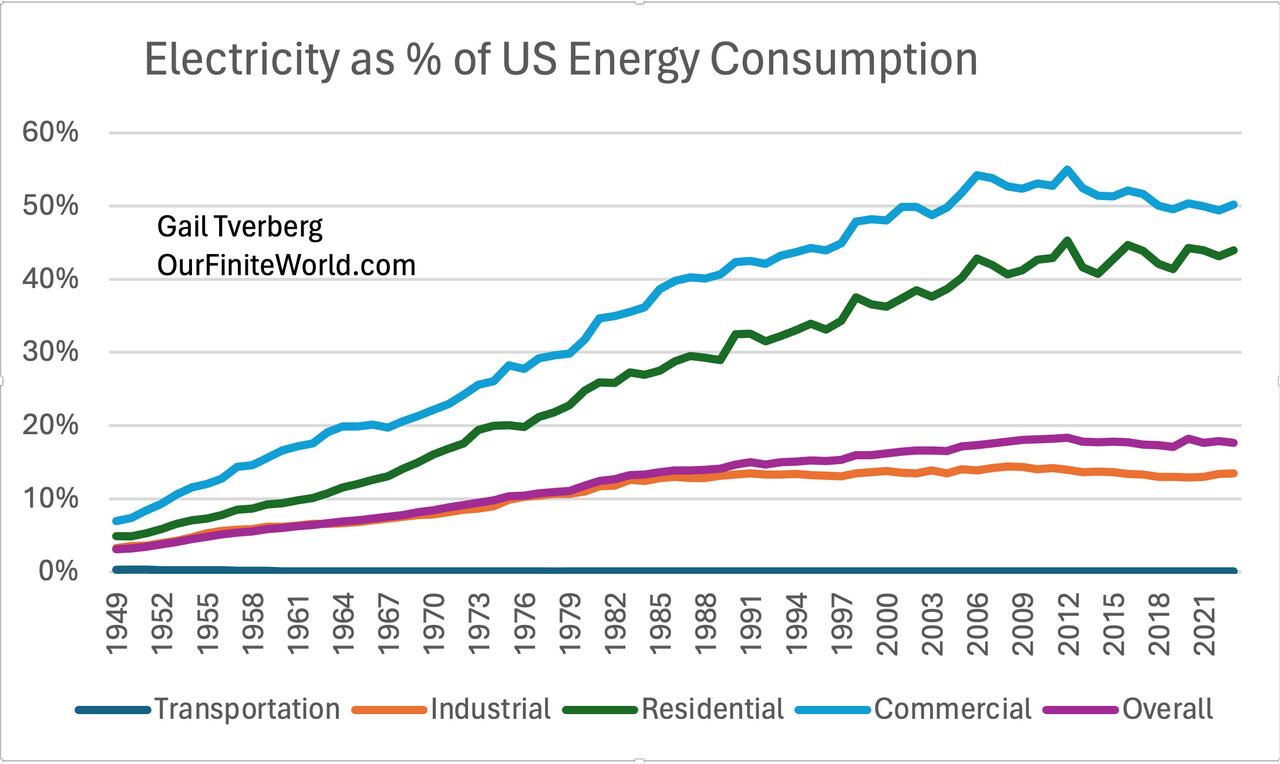
Figure 8 shows that the sector with the highest share of electricity use is the commercial sector. This includes uses such as stores, offices, and hospitals. The most visible energy use is lighting and operating computers, which gives the perception that electricity is the greatest energy use. But these businesses also need to be heated, and heat is often produced by burning natural gas directly. Businesses also need back-up for their electrical systems. Such back-up is typically provided by diesel-powered generators.
Residential usage is similar. It is easy to see the use of electricity, but heat is generally needed during winter. This is often provided by natural gas or propane. Natural gas is also often used in hot water heaters, stoves, and clothes dryers. Occasionally, wood is used to heat homes; this would go into the non-electricity portion, as well.
The thing that most people do not realize is that industrial use and transportation use are extremely large sectors of the economy (Figure 9), and these sectors are very low consumers of electricity (Figure 8). Also, if the US and Europe were to re-industrialize to produce more of our manufactured goods, our industrial sectors would need to be much larger than they are today.
In recent years, electrical consumption as a percentage of total energy consumption for the industrial sector has averaged about 13% of the total (Figure 9). Industries typically need high heat levels; such heat can usually be achieved at lowest cost by burning fossil fuels directly. Wikipedia claims, “Electric arc steelmaking is only economical where there is plentiful, reliable electricity, with a well-developed electrical grid.” An electric grid, powered only by intermittent electricity from wind turbines and solar panels, would not qualify.
In Figure 8, electricity consumption as a percentage of total energy consumption for the US transportation sector rounds to 0%, for every year. Even the amount of biomass (ethanol and biodiesel) used by the transportation sector doesn’t have much of an impact, as shown in Figure 10.
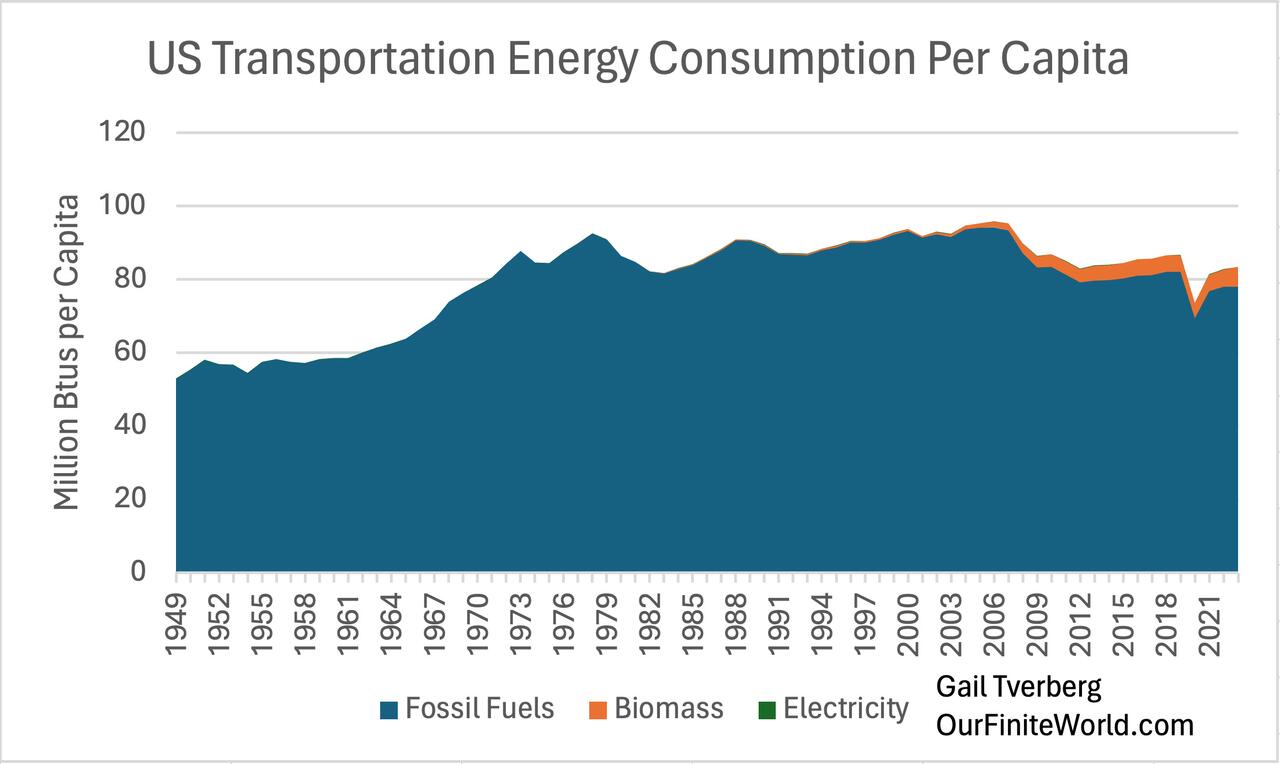
A major issue is that transportation is a broad sector, including trucks, trains, planes, and boats, in addition to private passenger autos. Also, I expect that the only electricity that would be considered in the transportation energy calculation would be electricity purchased from an away-from-home charging facility. Electricity used when charging at home would likely be part of residential electricity consumption.
[10] The narrative saying that we can transition to an electricity-only economy, powered by intermittent wind and solar electricity, has major holes in it.
One major issue is that the pricing of wind and solar tends to drive out other electricity providers, particularly nuclear. Intermittent wind and solar are given “priority” when they are available. This leads to very low or negative prices for other electricity providers. Nuclear is particularly affected because it cannot ramp up and down, in response to prices that are far below its cost of production.
Nuclear is a far more stable source of electricity than either wind or solar, and it is also a low-carbon source. As a result, economies end up worse off, in terms of electricity supply per capita, and in stability of available supply, when wind and solar are added.
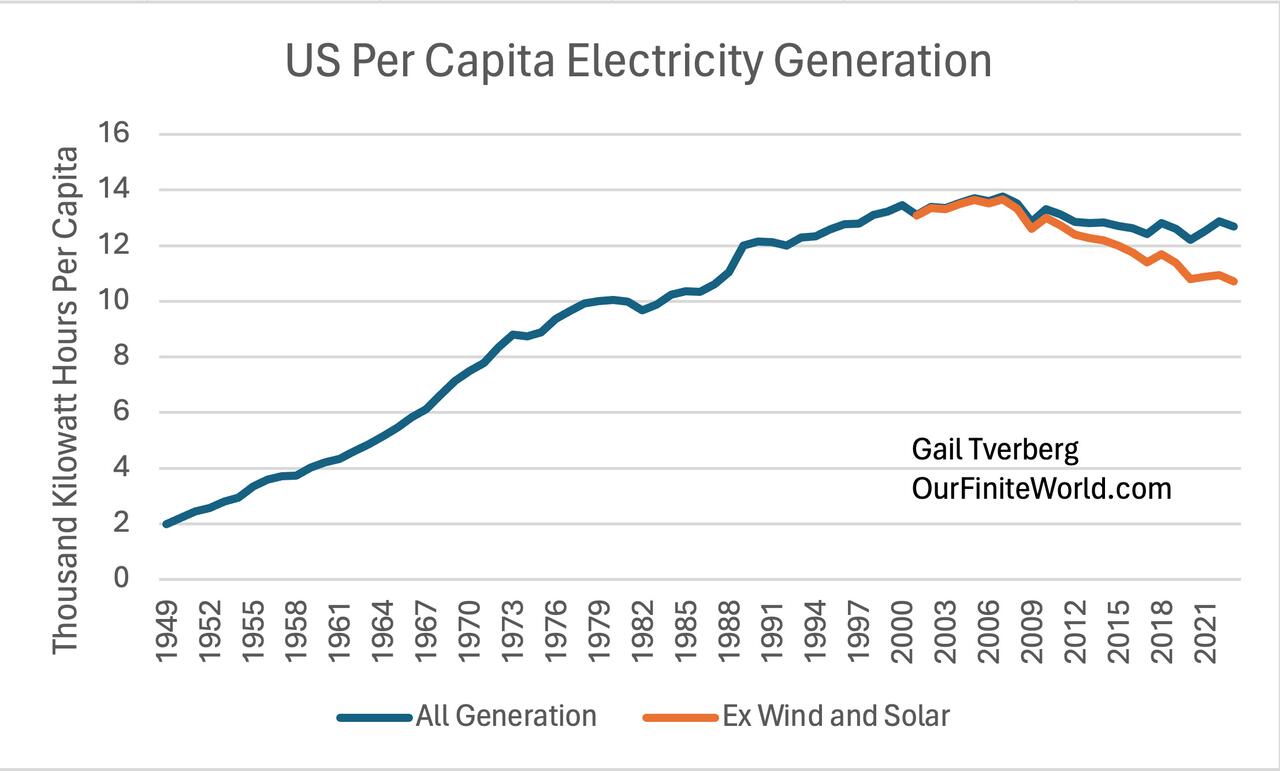
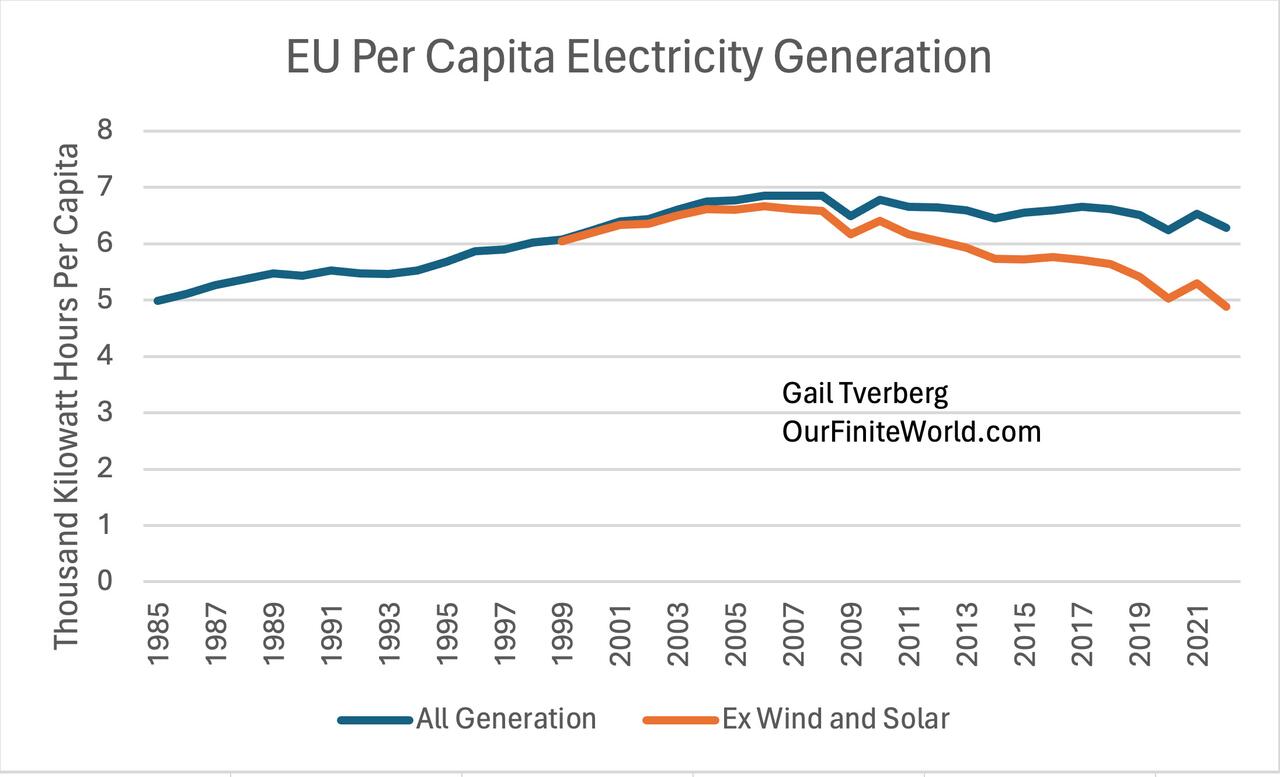
Another issue is that wind turbines and solar panels are made with fossil fuels and repaired using fossil fuels. Without fossil fuels, we cannot maintain electricity transmission lines and roads. Thus, wind turbines and solar panels are as much a part of the fossil fuel system as hydroelectric electricity and electricity made from coal or natural gas.
Also, as discussed above, only a small share of the economy is today operated using electricity. The IEA says that 20% of 2023 world energy supply comes from electricity. The amounts I calculated as “Overall” in Figure 8 indicate an electricity share of 18%, which is a bit less than the IEA is indicating for the world. Figure 8 shows an early upward trend in this ratio, but no upward trend since 2012. Fossil fuels are being used today because they have chemical characteristics that are needed or because they provide the energy services required in a less expensive manner than electricity.
Even in the early days of the Industrial Revolution, wind and waterpower provided only a small portion of the total energy supply. Coal provided the heat energy that both industry and residences needed, inexpensively. Wind and waterpower were not well adapted to providing heat energy when needed.

If we are short of inexpensive-to-extract fossil fuels, relative to today’s large population, we certainly could use some new inexpensive source of stable electricity supply. But this would not solve all our energy problems–we would still need a substantial amount of fossil fuel supplies to grow our food and keep our roads repaired. But if a new type of electricity production could reduce the demand for fossil fuels, it would make a larger quantity of fossil fuels available for other purposes.
[11] Practically everyone would like a happily-ever-after ending, so it is easy for politicians, educators, and the news media to put together overly optimistic versions of the future.
The narrative that CO2 is the world’s biggest enemy, so we need to move quickly away from fossil fuels, has received a great deal of publicity recently, but it is problematic from two different points of view:
(a) The feasibility of moving away from fossil fuels without killing off a very major portion of the world’s population seems to be virtually zero. The world economy is a dissipative structure in physics terms. It needs energy of the right kinds to “dissipate,” just as humans are dissipative structures and need food to dissipate (digest). Humans cannot live on lettuce alone, or practically any other foodstuff by itself. We need a “portfolio” of foods, adapted to our bodies’ needs. The economy is similar. It cannot operate only on electricity, any more than humans can live only on high-priced icing for cakes.
(b) The narrative about the importance of CO2 emissions with respect to climate change is quite possibly exaggerated. There are many other things that would seem to be at least as likely to cause short-term shifts in temperatures:
- Lack of global dimming caused by less coal dust and reduced sulfur compounds in the atmosphere; in other words, reducing smog tends to raise temperatures.
- Small changes in the Earth’s orbit
- Changes in solar activity
- Changes related to volcanic eruptions
- Changes related to shifts in the magnetic north and south poles
Politicians, educators, and the news media would all like a narrative that can explain the need for moving away from fossil fuels, rather than admit that “our easy to extract fossil fuel supply is running out.” The climate change narrative has been an easy approach to highlight, since clearly the climate is changing. It also provides the view that somehow we will be able to fix the problem if we take it seriously enough.
[12] Today, we are in a period of conflict among nations, indirectly related to not having access to enough fossil fuels for a world population of 8 billion. There is also a significant chance of financial collapse.
In my opinion, today’s world is a little like the “Roaring 20s” that came shortly before a major stock market crash in 1929 and the Great Depression of the 1930s. After the Great Depression, the world entered World War II. There is huge wage and wealth disparity; energy supplies per capita are stretched.
Today, NATO and Russia are fighting a proxy war in Ukraine. Russia is a major fossil fuel producer; it would like to be paid more for the energy products it sells. Russia could perhaps get better prices by selling oil and other energy products to Asian customers instead of its current customer mix. At the same time, the US claims primary leadership (hegemony) in the world but, in fact, it needs to import many goods from overseas. It even needs supply lines from around the world for weapons being sent to Ukraine. The Ukraine conflict is not going well for the US.
I do not know how this will work out. I am hoping that there will not be a World War III, in the same way that there was a World War II. All countries are terribly dependent on each other, even though there are not enough fossil fuels to go around. Perhaps countries will try to sabotage one another, using modern techniques, such as cyber warfare.
I think that there is a substantial chance of a major financial collapse in the next few years. The level of debt is very high now. A major recession, with lots of collapsing debt, seems to be a strong possibility.
[13] A presentation I recently gave to a group of actuaries that touches on several of these issues, plus others.
My presentation can be found at this link: Beware: The Economy Is Beginning to Shrink

