How cool would it be if we all had a portable fusion reactor in our home, jetson's like and unlimited energy available? Although nobody will entertain such fantasies nowadays, talking about renewables in similar glowing praise is not only still possible but encouraged, so much so that voicing doubts about the potential of renewables is frowned upon. With the risk of sounding like an heretic after mass, the limits of green energy are nevertheless getting clearer, even while the real costs are obfuscated and hidden behind the curtain of "clean" which most are not.
The reality as this article makes clear with detailed numbers, is that the future of our current society cannot be "green", and if it is, it will be a rather dark future, sliced with intermittent brown-outs and horrendously expensive electricity. (The two most likely options when you read between the lines.) Of all subjects, energy is the one which does least tolerate "ideology" and short-cuts. Physics guaranties that the road to really green energy will be a long one which will require a complete re-engineering of our society, the way we live and the way we think. That social crisis will therefore arrive long before we have invested the 30 to 50 years of effort necessary for green technological development. We most certainly could have invested the hundreds of billions of dollars used for nuclear weapons over the last 70 years into energy but that option never was on the table. Now, we are facing our growing needs for energy with dwindling fossil resources, while our population is still exploding and all these not-so-clean green energies remain marginal...
Authored by Gail Tverberg via Our Finite World,
We have been told that intermittent electricity from wind and solar, perhaps along with hydroelectric generation (hydro), can be the basis of a green economy. Things are increasingly not working out as planned, however. Natural gas or coal used for balancing the intermittent output of renewables is increasingly high-priced or not available. It is becoming clear that modelers who encouraged the view that a smooth transition to wind, solar, and hydro is possible have missed some important points.
Let’s look at some of the issues:
[1] It is becoming clear that intermittent wind and solar cannot be counted on to provide adequate electricity supply when the electrical distribution system needs them.
Early modelers did not expect that the variability of wind and solar would be a huge problem. They seemed to believe that, with the use of enough intermittent renewables, their variability would cancel out. Alternatively, long transmission lines would allow enough transfer of electricity between locations to largely offset variability.
In practice, variability is still a major problem. For example, in the third quarter of 2021, weak winds were a significant contributor to Europe’s power crunch. Europe’s largest wind producers (Britain, Germany and France) produced only 14% of installed capacity during this period, compared with an average of 20% to 26% in previous years. No one had planned for this kind of three-month shortfall.
In 2021, China experienced dry, windless weather so that both its generation from wind and hydro were low. The country found it needed to use rolling blackouts to deal with the situation. This led to traffic lights failing and many families needing to eat candle-lit dinners.
In Europe, with low electricity supply, Kosovo has needed to use rolling blackouts. There is real concern that the need for rolling blackouts will spread to other parts of Europe, as well, either later this winter, or in a future winter. Winters are of special concern because, then, solar energy is low while heating needs are high.
[2] Adequate storage for electricity is not feasible in any reasonable timeframe. This means that if cold countries are not to “freeze in the dark” during winter, fossil fuel backup is likely to be needed for many years in the future.
One workaround for electricity variability is storage. A recent Reuters’ article is titled, Weak winds worsened Europe’s power crunch; utilities need better storage. The article quotes Matthew Jones, lead analyst for EU Power, as saying that low or zero-emissions backup-capacity is “still more than a decade away from being available at scale.” Thus, having huge batteries or hydrogen storage at the scale needed for months of storage is not something that can reasonably be created now or in the next several years.
Today, the amount of electricity storage that is available can be measured in minutes or hours. It is mostly used to buffer short-term changes, such as the wind temporarily ceasing to blow or the rapid transition created when the sun sets and citizens are in the midst of cooking dinner. What is needed is the capacity for multiple months of electricity storage. Such storage would require an amazingly large quantity of materials to produce. Needless to say, if such storage were included, the cost of the overall electrical system would be substantially higher than we have been led to believe. All major types of cost analyses (including the levelized cost of energy, energy return on energy invested, and energy payback period) leave out the need for storage (both short- and long-term) if balancing with other electricity production is not available.
If no solution to inadequate electricity supply can be found, then demand must be reduced by one means or another. One approach is to close businesses or schools. Another approach is rolling blackouts. A third approach is to permit astronomically high electricity prices, squeezing out some buyers of electricity. A fourth balancing approach is to introduce recession, perhaps by raising interest rates; recessions cut back on demand for all non-essential goods and services. Recessions tend to lead to significant job losses, besides cutting back on electricity demand. None of these things are attractive options.
[3] After many years of subsidies and mandates, today’s green electricity is only a tiny fraction of what is needed to keep our current economy operating.
Early modelers did not consider how difficult it would be to ramp up green electricity.
Compared to today’s total world energy consumption (electricity and non-electricity energy, such as oil, combined), wind and solar are truly insignificant. In 2020, wind accounted for 3% of the world’s total energy consumption and solar amounted to 1% of total energy, using BP’s generous way of counting electricity, relative to other types of energy. Thus, the combination of wind and solar produced 4% of world energy in 2020.
The International Energy Agency (IEA) uses a less generous approach for crediting electricity; it only gives credit for the heat energy supplied by the renewable energy. The IEA does not show wind and solar separately in its recent reports. Instead, it shows an “Other” category that includes more than wind and solar. This broader category amounted to 2% of the world’s energy supply in 2018.
Hydro is another type of green electricity that is sometimes considered alongside wind and solar. It is quite a bit larger than either wind or solar; it amounted to 7% of the world’s energy supply in 2020. Taken together, hydro + wind + solar amounted to 11% of the world’s energy supply in 2020, using BP’s methodology. This still isn’t much of the world’s total energy consumption.
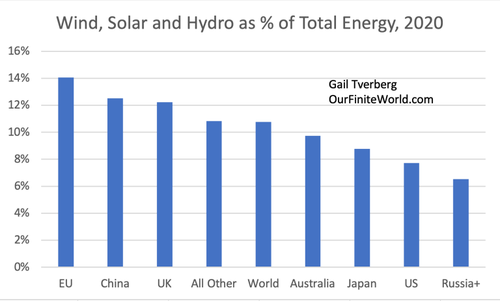
Of course, different parts of the world vary with respect to the share of energy created using wind, hydro and solar. Figure 1 shows the percentage of total energy generated by these three renewables combined.
Figure 1. Wind, solar and hydro as a share of total energy consumption for selected parts of the world, based on BP’s 2021 Statistical Review of World Energy data. Russia+ is Russia and its affiliates in the Commonwealth of Independent States (CIS).
As expected, the world average is about 11%. The European Union is highest at 14%; Russia+ (that is, Russia and its Affiliates, which is equivalent to the members of the Commonwealth of Independent States) is lowest at 6.5%.
[4] Even as a percentage of electricity, rather than total energy, renewables still comprised a relatively small share in 2020.
Wind and solar don’t replace “dispatchable” generation; they provide some temporary electricity supply, but they tend to make the overall electrical system more difficult to operate because of the variability introduced. Renewables are available only part of the time, so other types of electricity suppliers are still needed when supply temporarily isn’t available. In a sense, all they are replacing is part of the fuel required to make electricity. The fixed costs of backup electricity providers are not adequately compensated, nor are the costs of the added complexity introduced into the system.
If analysts give wind and solar full credit for replacing electricity, as BP does, then, on a world basis, wind electricity replaced 6% of total electricity consumed in 2020. Solar electricity replaced 3% of total electricity provided, and hydro replaced 16% of world electricity. On a combined basis, wind and solar provided 9% of world electricity. With hydro included as well, these renewables amounted to 25% of world electricity supply in 2020.
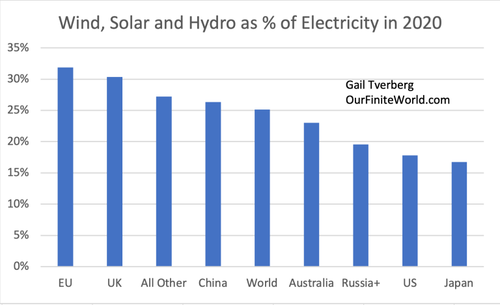
The share of electricity supply provided by wind, solar and hydro varies across the world, as shown in Figure 2. The European Union is highest at 32%; Japan is lowest at 17%.
Figure 2. Wind, solar and hydro as a share of total electricity supply for selected parts of the world, based on BP’s 2021 Statistical Review of World Energy data.
The “All Other” grouping of countries shown in Figure 2 includes many of the poorer countries. These countries often use quite a bit of hydro, even though the availability of hydro tends to fluctuate a great deal, depending on weather conditions. If an area is subject to wet seasons and dry seasons, there is likely to be very limited electricity supply during the dry season. In areas with snow melt, very large supplies are often available in spring, and much smaller supplies during the rest of the year.
Thus, while hydro is often thought of as being a reliable source of power, this may or may not be the case. Like wind and solar, hydro often needs fossil fuel back-up if industry is to be able to depend upon having electricity year-around.
[5] Most modelers have not understood that reserve to production ratios greatly overstate the amount of fossil fuels and other minerals that the economy will be able to extract.
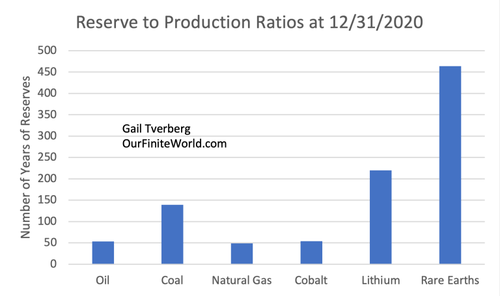
Most modelers have not understood how the world economy operates. They have assumed that as long as we have the technical capability to extract fossil fuels or other minerals, we will be able to do so. A popular way of looking at resource availability is as reserve to production ratios. These ratios represent an estimate of how many years of production might continue, if extraction is continued at the same rate as in the most recent year, considering known resources and current technology.
Figure 3. Reserve to production ratios for several minerals, based on data from BP’s 2021 Statistical Review of World Energy.
A common belief is that these ratios understate how much of each resource is available, partly because technology keeps improving and partly because exploration for these minerals may not be complete.
In fact, this model of future resource availability greatly overstates the quantity of future resources that can actually be extracted. The problem is that the world economy tends to run short of many types of resources simultaneously. For example, World Bank Commodities Price Data shows that prices were high in January 2022 for many materials, including fossil fuels, fertilizers, aluminum, copper, iron ore, nickel, tin and zinc. Even though prices have run up very high, this is not an indication that producers will be able to use these high prices to extract more of these required materials.
In order to produce more fossil fuels or more minerals of any kind, preparation must be started years in advance. New oil wells must be built in suitable locations; new mines for copper or lithium or rare earth minerals must be built; workers must be trained for all of these areas. High prices for many commodities can be a sign of temporarily high demand, or it can be a sign that something is seriously wrong with the system. There is no way the system can ramp up needed production in a huge number of areas at once. Supply lines will break. Recession is likely to set in.
The problem underlying the recent spike in prices seems to be “diminishing returns.” Such diminishing returns affect nearly all parts of the economy simultaneously. For each type of mineral, miners produced the easiest-t0-extract materials first. They later moved on to deeper oil wells and minerals from lower grade ores. Pollution gradually grew, so, it too, needed greater investment. At the same time, world population has been growing, so the economy has required more food, fresh water and goods of many kinds; these, too, require the investment of resources of many kinds.
The problem that eventually hits the economy is that it cannot maintain economic growth. Too many areas of the economy require investment, simultaneously, because diminishing returns keeps ramping up investment needs. This investment is not simply a financial investment; it is an investment of physical resources (oil, coal, steel, copper, etc.) and an investment of people’s time.
The way in which the economy would run short of investment materials was simulated in the 1972 book, The Limits to Growth, by Donella Meadows and others. The book gave the results of a number of simulations regarding how the world economy would behave in the future. Virtually all of the simulations indicated that eventually the economy would reach limits to growth. A major problem was that too large a share of the output of the economy was needed for reinvestment, leaving too little for other uses. In the base model, such limits to growth came about now, in the middle of the first half of the 21st century. The economy would stop growing and gradually start to collapse.
[6] The world economy seems already to be reaching limits on the extraction of coal and natural gas to be used for balancing electricity provided by intermittent renewables.
Coal and natural gas are expensive to transport so, if they are exported, they primarily tend to be exported to countries that are nearby. For this reason, my analysis groups together exports and imports into large regions where trade is most likely to take place.
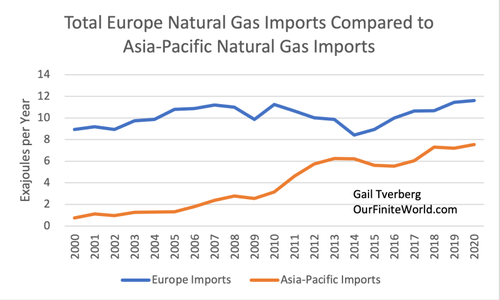
If we analyze natural gas imports by part of the world, two regions stand out as having the most out-of-region natural gas imports: Europe and Asia-Pacific. Figure 4 shows that Europe’s out-of region natural gas imports reached peaks in 2007 and 2010, after which they dipped. In recent years, Europe’s imports have barely surpassed their prior peaks. Asia-Pacific’s out-of-region imports have shown a far more consistent growth long-term growth pattern.
Figure 4. Natural gas imports in exajoules per year, based on data from on data from BP’s 2021 Statistical Review of World Energy.
The reason why Asia-Pacific’s imports have been growing is to support its growing manufacturing output. Manufacturing output has increasingly been shifted to the Asia-Pacific region, partly because this region can perform this manufacturing cheaply, and partly because rich countries have wanted to reduce their carbon footprint. Moving heavy industry abroad reduces a country’s reported CO2 generation, even if the manufactured items are imported as finished products.
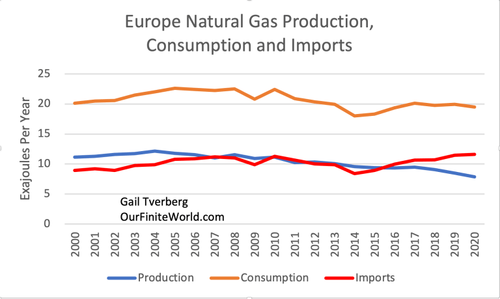
Figure 5 shows that Europe’s own natural gas supply has been falling. This is a major reason for its import requirements from outside the region.
Figure 5. Europe’s natural gas production, consumption and imports based on data from BP’s 2021 Statistical Review of World Energy.
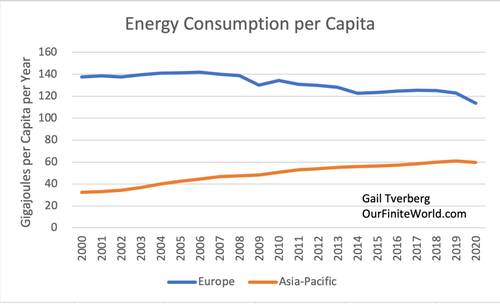
Figure 6, below, shows that Asia-Pacific’s total energy consumption per capita has been growing. The new manufacturing jobs transferred to this region have raised standards of living for many workers. Europe, on the other hand, has reduced its local manufacturing. Its people have tended to get poorer, in terms of energy consumption per capita. Service jobs necessitated by reduced energy consumption per capita have tended to pay less well than the manufacturing jobs they have replaced.
Figure 6. Energy consumption per capita for Europe compared to Asia-Pacific, based on data from BP’s 2021 Statistical Review of World Energy.
Europe has recently been having conflicts with Russia over natural gas. The world seems to be reaching a situation where there are not enough natural gas exports to go around. The Asia-Pacific Region (or at least the more productive parts of the Asia-Pacific Region) seems to be able to outbid Europe, when local natural gas supply is inadequate.
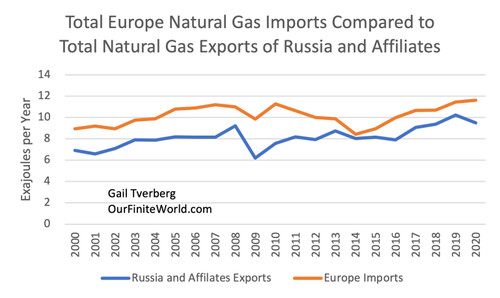
Figure 7, below, gives a rough idea of the quantity of exports available from Russia+ compared to Europe’s import needs. (In this chart, I compare Europe’s total natural gas imports (including pipeline imports from North Africa and LNG from North Africa) with the natural gas exports of Russia+ (to all nations, not just to Europe, including both by pipeline and as LNG)). On this rough basis, we find that Europe’s natural gas imports are greater than the total natural gas exports of Russia+.
Figure 7. Total natural gas imports of Europe compared to total natural gas exports from Russia+, based on data from BP’s 2021 Statistical Review of World Energy.
Europe is already encountering multiple natural gas problems. Its supply from North Africa is not as reliable as in the past. The countries of Russia+ are not delivering as much natural gas as Europe would like, and spot prices, especially, seem to be way too high. There are also pipeline disagreements. Bloomberg reports that Russia will be increasing its exports to China in future years. Unless Russia finds a way to ramp up its gas supplies, greater exports to China are likely to leave less natural gas for Russia to export to Europe in the years ahead.
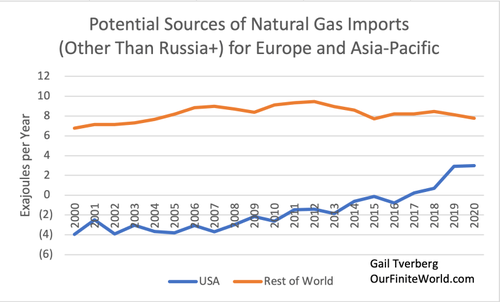
If we look around the world to see what other sources of natural gas exports are available for Europe, we discover that the choices are limited.
Figure 8. Historical natural gas exports based on data from BP’s 2021 Statistical Review of World Energy. Rest of the world includes Africa, the Middle East and the Americas excluding the United States.
The United States is presented as a possible choice for increasing natural gas imports to Europe. One of the catches with growing natural gas exports from the United States is the fact that historically, the US has been a natural gas importer; it is not clear how much exports can rise above the 2022 level. Furthermore, part of US natural gas is co-produced with oil from shale. Oil from shale is not likely to be growing much in future years; in fact, it very likely will be declining because of depleted wells. This may limit the US’s growth in natural gas supplies available for export.
The Rest of the World category on Figure 8 doesn’t seem to have many possibilities for growth in imports to Europe, either, because total exports have been drifting downward. (The Rest of the World includes Africa, the Middle East, and the Americas excluding the United States.) There are many reports of countries, including Iraq and Turkey, not being able to buy the natural gas they would like. There doesn’t seem to be enough natural gas on the market now. There are few reports of supplies ramping up to replace depleted supplies.
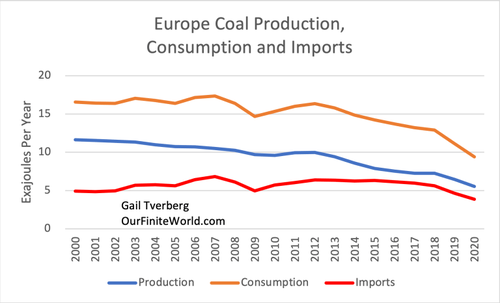
With respect to coal, the situation in Europe is only a little different. Figure 9 shows that Europe’s coal supply has been depleting, and imports have not been able to offset this depletion.
Figure 9. Europe’s coal production, consumption and imports, based on data from BP’s 2021 Statistical Review of World Energy.
If a person looks around the world for places to get more imports for Europe, there aren’t many choices.
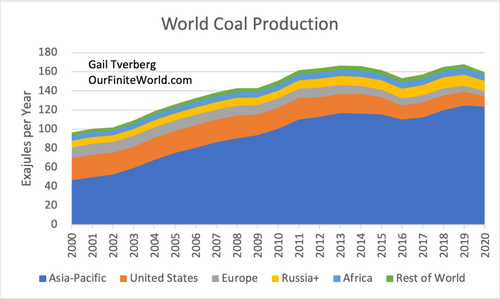
Figure 10. Coal production by part of the world, based on data from BP’s 2021 Statistical Review of World Energy.
Figure 10 shows that most coal production is in the Asia-Pacific region. With China, India and Japan located in the Asia-Pacific Region, and high transit costs, this coal is unlikely to leave the region. The United States has been a big coal producer, but its production has declined in recent years. It still exports a relatively small amount of coal. The most likely possibility for increased coal imports would be from Russia and its affiliates. Here, too, Europe is likely to need to outbid China to purchase this coal. A better relationship with Russia would be helpful, as well.
Figure 10 shows that world coal production has been essentially flat since 2011. A country will only export coal that it doesn’t need itself. Thus, a shortfall in export capability is an early warning sign of inadequate overall supply. With the economies of many Asia-Pacific countries still growing rapidly, demand for coal imports is likely to grow for this region. While modelers may think that there is close to 150 years’ worth of coal supply available, real-world experience suggests that coal limits are being reached already.
[7] Conclusion. Modelers and leaders everywhere have had a basic misunderstanding of how the economy operates and what limits we are up against. This misunderstanding has allowed scientists to put together models that are far from the situation we are actually facing.
The economy operates as an integrated whole, just as the body of a human being operates as an integrated whole, rather than a collection of cells of different types. This is something most modelers don’t understand, and their techniques are not equipped to deal with.
The economy is facing many limits simultaneously: too many people, too much pollution, too few fish in the ocean, more difficult to extract fossil fuels and many others. The way these limits play out seems to be the way the models in the 1972 book, The Limits to Growth, suggest: They play out on a combined basis. The real problem is that diminishing returns leads to huge investment needs in many areas simultaneously. One or two of these investment needs could perhaps be handled, but not all of them, all at once.
The approach of modelers, practically everywhere, is to break down a problem into small parts, and assume that each part of the problem can be solved independently. Thus, those concerned about “Peak Oil” have been concerned about running out of oil. Finding substitutes seemed to be important. Those concerned about climate change were convinced that huge amounts of fossil fuels remain to be extracted, even more than the amounts indicated by reserve to production ratios. Their concern was finding substitutes for the huge amount of fossil fuels that they believed remained to be extracted, which could cause climate change.
Politicians could see that there was some sort of huge problem on the horizon, but they didn’t understand what it was. The idea of substituting renewables for fossil fuels seemed to be a solution that would make both Peak Oilers and those concerned about climate change happy. Models based on the substitution of renewables for fossil fuels seemed to please almost everyone. The renewables approach suggested that we have a very long timeframe to deal with, putting the problem off, as long into the future as possible.
Today, we are starting to see that renewables are not able to live up to the promise modelers hoped they would have. Exactly how the situation will play out is not entirely clear, but it looks like we will all have front row seats in finding out.


No comments:
Post a Comment