How do you fix a problem 50 years in the making?
The short answer is: "You don't!" So politicians will keep adding oil to the fire until the economic machine blows. There are no other options. It's the only thing they know how to do and the only thing electors will vote for. Anything else is complex, requires sacrifices and compromises. "Out of the question!" is an understatement so explode the machine will!
David Stockman is a voice of reason in an unreasonable world. It is safe to bet that absolutely nobody will listen to him in Washington!
Authored by David Stockman via InternationalMan.com,
These people have to be stopped!
We are talking about the nation’s unhinged monetary politburo domiciled in the Eccles Building, of course. It is bad enough that their relentless inflation of financial assets has showered the 1% with untold trillions of windfall gains, but their ultimate crime is that they lured the nation’s elected politician into a veritable fiscal trance. Consequently, future generations will be lugging the service costs on insuperable public debts for years to come.
For more than two decades these foolish PhDs and monetary apparatchiks drove the entire Treasury yield curve to rock bottom, even as public debt erupted skyward. In this context, the single biggest chunk of the Treasury debt lies in the 90-day T-bill sector, but between December 2007 and June 2023 the inflation-adjusted yield on this workhorse debt security was negative 95% of the time.
That’s right. During that 187-month span, the interest rate exceeded the running (LTM) inflation rate during only nine months, as depicted by the purple area picking above the zero bound in the chart, and even then by just a tad. All the rest of the time, Uncle Sam was happily taxing the inflationary rise in nominal incomes, even as his debt service payments were dramatically lagging the 78% rise of CPI during that period.
Inflation-Adjusted Yield On 90-Day T-bills, 2007 to 2022
The above was the fiscal equivalent of Novocain. It enabled the elected politicians to merrily jig up and down Pennsylvania Avenue and stroll the K-Street corridors dispensing bountiful goodies left and right, while experiencing nary a moment of pain from the massive debt burden they were piling on the main street economy.
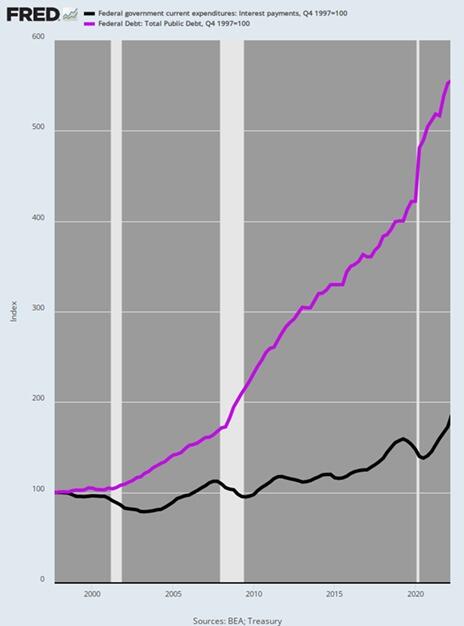
Accordingly, during the quarter-century between Q4 1997 and Q1 2022 the public debt soared from $5.5 trillion to $30.4 trillion or by 453%. In any rational world a commensurate rise in Federal interest expense would have surely awakened at least some of the revilers.
But not in Fed World. As it happened, Uncle Sam’s interest expense only increased by 73%, rising from $368 billion to $635 billion per year during the same period. By contrast, had interest rates remained at the not unreasonable levels posted in late 1997, the interest expense level by Q1 2022, when the Fed finally awakened to the inflationary monster it had fostered, would have been $2.03 trillion per annum.
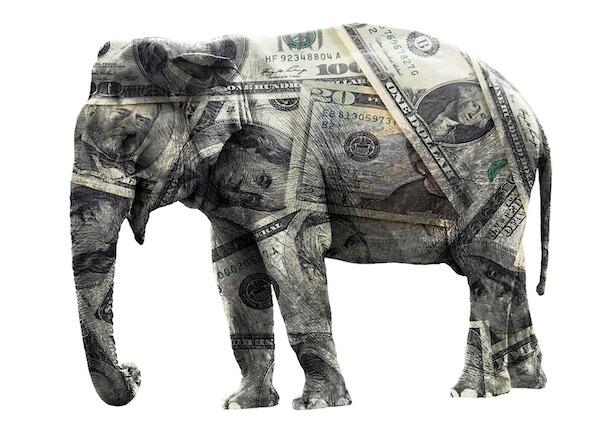
In short, the Fed reckless and relentless repression of interest rates during that quarter century fostered an elephant in the room that was one for the ages. Annualized Federal interest expense was fully $1.3 trillion lower than would have been the case at the yield curve in place in Q4 1997.
Alas, the missing interest expense amounted to the equivalent of the entire social security budget!
So, we’d guess the politicians might have been aroused from their slumber had interest expense reflected market rates. Instead, they were actually getting dreadfully wrong price signals and the present fiscal catastrophe is the consequence.
Index Of Public Debt Versus Federal Interest Expense, Q4 1997-Q1 2022
Needless to say, the US economy was not wallowing in failure or under-performance at the rates which prevailed in 1997. In fact, during that year real GDP growth was +4.5%, inflation posted at just 1.7%, real median family income rose by 3.2%, job growth was 2.8% and the real interest rates on the 10-year UST was +4.0%.
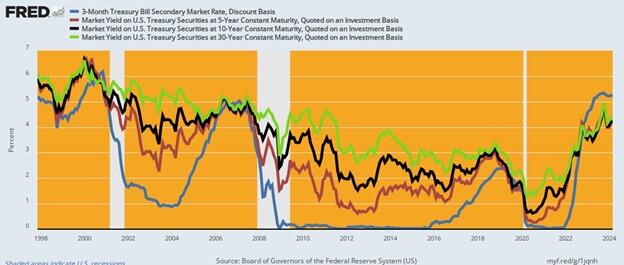
In short, 1997 generated one of the strongest macroeconomic performances in recent decades—even with inflation-adjusted yields on the 10-year UST of +4.0%. So there was no compelling reason for a massive compression of interest rates, but that is exactly what the Fed engineered over the next two decades. As shown in the graph below, rates were systematically pushed lower by 300 to 500 basis points across the curve by the bottom in 2020-2021.
Current yields are higher by 300 to 400 basis points from this recent bottom, but here’s the thing: They are only back to nominal levels prevalent at the beginning of the period in 1997, even as inflation is running at 3-4% Y/Y increases, or double the levels of 1997.
US Treasury Yields, 1997 to 2024
Unfortunately, even as the Fed has tepidly moved toward normalization of yields as shown in the graph above, Wall Street is bringing unrelenting pressure for a new round of rates cuts, which would result in yet another spree of the deep interest rate repression and distortion that has fueled Washington’s fiscal binge since the turn of the century.
As it is, the public debt is already growing at an accelerating clip, even before the US economy succumbs to the recession that is now gathering force. And we do mean accelerating. The public debt has recently been increasing by $1 trillion every 100 days. That’s $10 billion per day, $416 million per hour.
In fact, Uncle Sam’s debt has risen by $470 billion in the first two months of this year to $34.5 trillion and is on pace to surpass $35 trillion in a little over a month, $37 trillion well before year’s end, and $40 trillion some time in 2025. That’s about two years ahead of the current CBO (Congressional Budget Office) forecast.
On the current path, moreover, the public debt will reach $60 trillion by the end of the 10-year budget window. But even that depends upon the CBO’s latest iteration of Rosy Scenario, which envisions no recession ever again, just 2% inflation as far as the eye can see and real interest rates of barely 1%. And that’s to say nothing of the trillions in phony spending cuts and out-year tax increases that are built into the CBO baseline but which Congress will never actually allow to materialize.
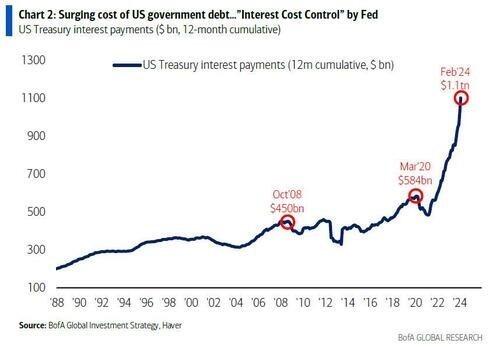
What is worse, even with partial normalization of rates, a veritable tsunami of Federal interest expense is now gathering steam. That is because the ultra-low yields of 2007 to 2022 are now rolling over into the current market rates shown above—at the same time that the amount of public debt outstanding is heading skyward. As a result, the annualized run rate of Federal interest expense hit $1.1 trillion in February and is heading for $1.6 trillion by the end of the current fiscal year in September.
Finally, even as the run-rate of interest expense has been soaring, the bureaucrats at the US Treasury have been drastically shortening the maturity of the outstanding debt, as it rolls over. Accordingly, more than $21 trillion of Treasury paper has been refinanced in the under one-year T-bill market, thereby lowering the weighted-average maturity of the public debt to less than five- years.
The apparent bet is that the Fed will be cutting rates soon. As is becoming more apparent by the day, however, that’s just not in the cards: No matter how you slice it, the running level of inflation has remained exceedingly sticky and shows no signs of dropping below its current 3-4% range any time soon.
What is also becoming more apparent by the day is that the money-printers at the Fed have led Washington into a massive fiscal calamity. It is only a matter of time, therefore, until the brown stuff hits the fan like never before.


No comments:
Post a Comment