Two years on, what
we have is not anecdotal evidence anymore but actual data to support the claim
that mRNA vaccines are dangerous.
Submitted by AP by THE EXPOSÉ
You were instructed to stay at home to protect the healthcare
system. But while you did so, hospitals essentially had a holiday, and
this is backed up by official data. You were told the answer to
everyone’s prayers was to get the Covid-19 injection. But now that you
have done so, the healthcare system is on the brink of collapse.
Waiting times for ambulances are at an all-time high. The
number of emergency calls due to people suffering cardiac arrest is at
an all-time high. The number of people dying is at an all-time high,
with hundreds of thousands of excess deaths occurring around the world
every single week.
And official Government reports prove without a shadow of a doubt that it is all thanks to the Covid-19 vaccines.
Ambulances in England are taking almost an hour to reach patients who
have had a suspected stroke or heart attack, more than three times the
18-minute maximum wait, the latest NHS data shows. When people call 999 they can no longer be confident that they will get the emergency care they need.
Why?
The following chart is taken from the UK Health Security Agency’s ‘Ambulance Syndromic Surveillance System – Week 30′
bulletin, and it shows the daily number of 999 calls requesting an
ambulance due to suffering cardiac arrest in England vs the expected
rate (black dotted line).
The daily number of calls has been way above average since at least August 2021.
The National Health Service (NHS) has also confirmed in response to a
freedom of information request that ambulance call-outs relating to
immediate care required for a debilitating condition affecting the heart
nearly doubled in the whole of 2021 and are still on the rise further
in 2022.
On the 25th April 2022, Duncan Husband sent a Freedom of Information (FOI) request
to the West Midlands Ambulance Service University NHS Foundation Trust
requesting to know the number of call-outs for patients with heart
conditions per year, between 1st January 2017 and the present day.
The NHS responded on the 18th May with a spreadsheet containing the requested information.
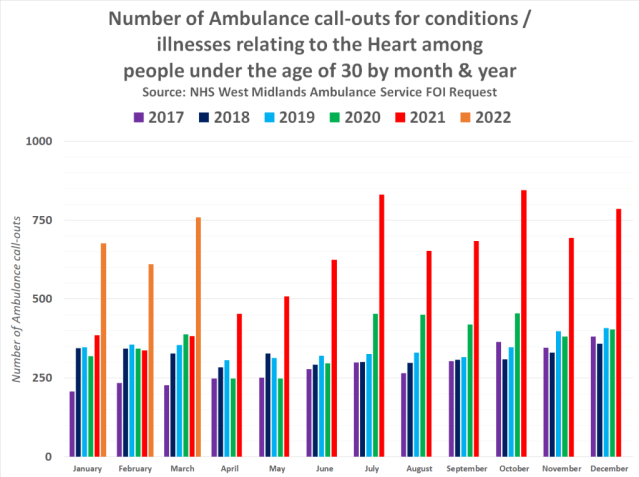
The following chart visualised the data made available in the spreadsheet –
ambulance call-ours for high conditions have been higher overall
since January 2021, and have been increasing month on month. It was not
until April 2021 that we saw a significant increase among people under
the age of 30 though, and it again has increased month on month since
then.
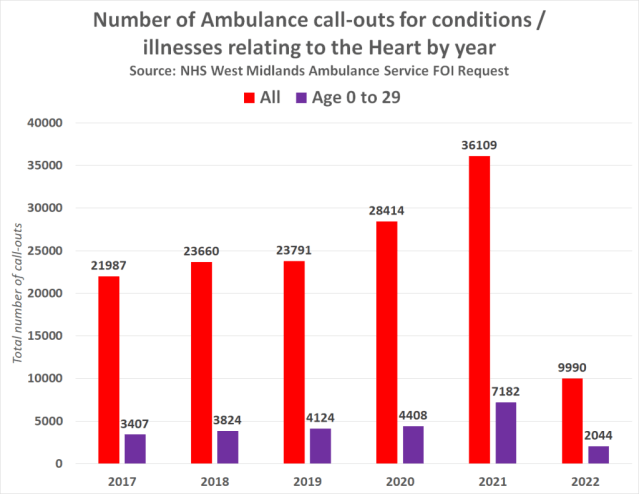
The following chart shows the overall total call-outs by year for everyone and those aged 0 to 29 –
The average number of annual call-outs between 2017 and 2020 equates
to 24,463. Meaning the number of call-outs increased by 48% in 2021. The
average number of annual call-outs among under 30’s between 2017 and
2020 equates to 3,940. Meaning the number of call-outs increased by 82%
in 2021.
The following chart shows the monthly average number of ambulance call-outs for conditions relating to the heart by year –
There was a significant increase in 2021 among all age groups, and
unfortunately, things got even worse in the first few months of 2022.
The question is, why?
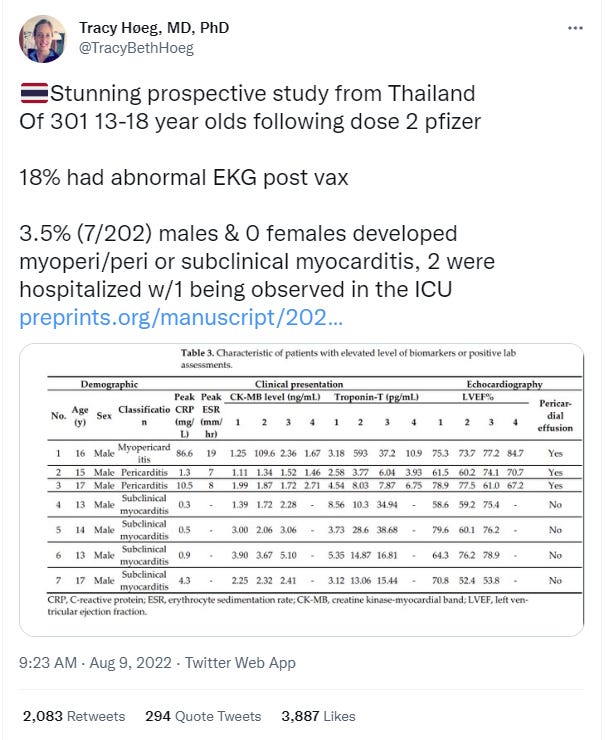
Let’s look at the fact that it is now known without any doubt that
Covid-19 vaccination can cause serious damage to the heart. Myocarditis
and Pericarditis are just two of the handful of adverse events medicine
regulators have been forced to admit can occur due to Covid-19
vaccination.
They claim it is rare, but they are lying. The fact their hand has
been forced in admitting they can occur means they are much more common
than the average person on the street would like to think.
A quietly published study conducted by the US Centers for Disease Control and Food and Drug Administration actually found that the risk of myocarditis following mRNA COVID vaccination is around 133x greater than the background risk in the population.
This means Covid vaccination increases the risk of suffering myocarditis by a shocking 13,200%.
Myocarditis is a condition that causes inflammation of the heart
muscle and reduces the heart’s ability to pump blood and can cause rapid
or abnormal heart rhythms.
Eventually, myocarditis weakens the heart so that the rest of the
body doesn’t get enough blood. Clots can then form in the heart, leading
to a stroke or heart attack. Other complications of the condition
include sudden cardiac death.
There is no mild version of myocarditis, it is extremely serious due
to the fact that the heart muscle is incapable of regenerating.
Therefore, one the damage is done there is no rewinding the clock.
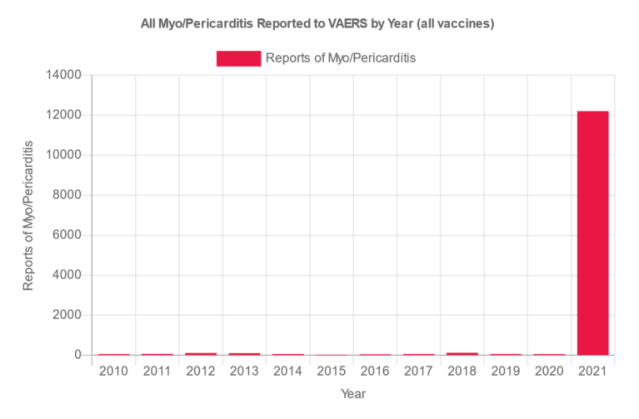
The following chart shows reports of myocarditis to the U.S. Centers for Disease Control’s Vaccine Adverse Event Reporting System by year –
Is there any wonder the number of ambulance call-outs in England
relating to conditions affecting the heart is at an all-time high?
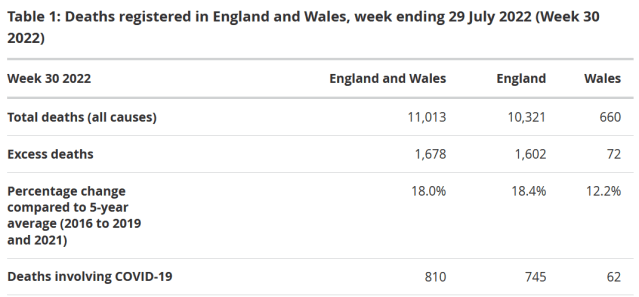
The Office for National Statistics (ONS) publishes weekly figures on deaths registered in England and Wales. The most recent data shows deaths up to 29th July 2022.
The following chart, created by the ONS, shows the number of deaths per week compared to the five-year average –
As you can see from the above, from around May 2021 onwards, England
and Wales recorded a huge amount of excess deaths that were not
attributed to Covid-19 compared to the five-year average. It then
appears that excess deaths dropped at the start of 2022.
But appearances can be deceiving, and the only reason they dropped is
that the ONS decided to include the 2021 data in the 5-year-average.
This makes it all the more concerning that excess deaths have been
recorded every week since the end of April 2022 compared to the
five-year average (2016 to 2019 + 2021).
The most recent week shows that there were 11,013 deaths in England
and Wales, equating to 1,678 excess deaths against the five-year
average. Only 810 of those deaths were attributed to Covid-19.
Most of Europe is also recording a significant amount of excess deaths, as can be seen in the following official chart compiled by Eurostat showing excess mortality across Europe in May 2022 –
The world is experiencing an extremely serious issue where tens to
hundreds of thousands more people are dying than what is expected every
single week.
But how can we prove these deaths are definitively due to Covid-19
vaccination? The answer lies in comparing the age-standardised mortality
rates per 100,00 among the vaccinated and unvaccinated.
The following is indisputable evidence that the Covid-19 vaccines are deadly and killing people in the thousands.
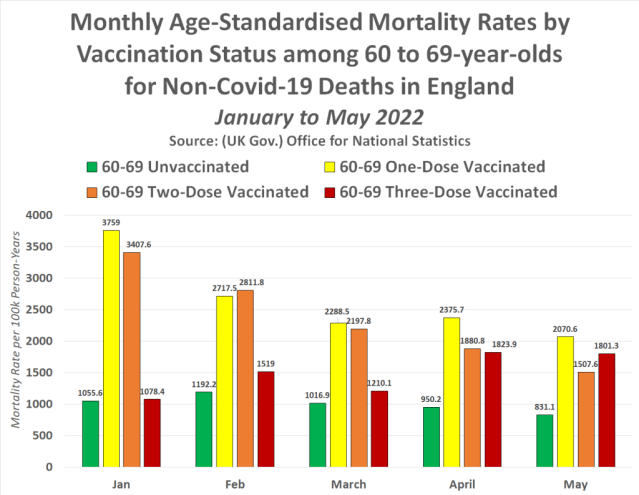
The following charts show the monthly age-standardised mortality
rates by vaccination status among each age group for Non-Covid-19 deaths
in England between January and May 2022, the figures can be found in
table 2 of a recently published dataset collated by the UK Government agency, the Office for National Statistics –
In every single month since the beginning of 2022, partly vaccinated
and double vaccinated 18-39-year-olds have been more likely to die than
unvaccinated 18 to 39-year-olds. Triple vaccinated 18 to 39-year-olds
however have had a mortality rate that has worsened by the month
following the mass Booster campaign that occurred in the UK in December
2021.
We also see a similar pattern among every single other age group.
These are age-standardised figures. There is no other conclusion that
can be found for the fact mortality rates per 100,000 are the lowest
among the unvaccinated other than that the Covid-19 injections are
killing people.
But just in case that isn’t enough to finally open your eyes tot his
devastating fact, here’s several more pieces of indisputable evidence to
back up this fact.
The UK Government has revealed that 1 in every 246 people vaccinated
against Covid-19 in England has died within 60 days of receiving a dose
of the Covid-19 vaccine.
Table 9 of the ONS ‘Deaths by vaccination status, England’ dataset contains figures on ‘Whole
period counts of all registered deaths grouped by how many weeks after
vaccination the deaths occurred; for deaths involving COVID-19 and
deaths not involving COVID-19, deaths occurring between 1 January 2021
and 31 May 2022, England’.
Here’s a chart showing the number of deaths within 60 days of
Covid-19 vaccination in England between 1st Jan 2021 and 31st March
2022, according to the Office for National Statistics dataset –
Between 1st Jan 21 and 31st May 2022, a total of 14,103 people died
with Covid-19 within 60 days of vaccination, and a total of 166,556
people died of any other cause within 60 days of vaccination.
This means that in all, 180,659 people died within 60 days of Covid-19 vaccination between January 2021 and May 2022 in England.
The following table is taken from page 65 of the UK Health Security Agency’s week 27 ‘Weekly national Influenza and COVID-19 surveillance report’, and shows vaccine uptake in England by age –
According to the UKHA, 44.48 million people have had a single dose,
41.8 million people have had two doses, and 32.9 million people have had
three doses as of July 3rd 2022.
Therefore, using simple maths, we find that 1 in every 246 vaccinated
people has died within 60 days of Covid-19 Vaccination in England.
44,480,115 (People vaccinated) / 180,659 (deaths) = 246 = 1 death for every 246 people vaccinated
The UK Medicine Regulator has confirmed that over a period of
nineteen months the Covid-19 Vaccines have caused at least 5.5x as many
deaths as all other available vaccines combined in the past 21 years.
This means, that when compared side by side, the Covid-19 injections are
a shocking 7,402% more deadly than every other vaccine available in the
UK.
The Medicine and Healthcare product Regulatory Agency (MHRA) confirmed in response to a Freedom of Information request
(FOI) that had received a grand total of 404 reported adverse reactions
to all available vaccines (excluding the Covid-19 injections)
associated with a fatal outcome between the 1st January 2001 and the
25th August 2021 – a time frame of 20 years and 8 months.
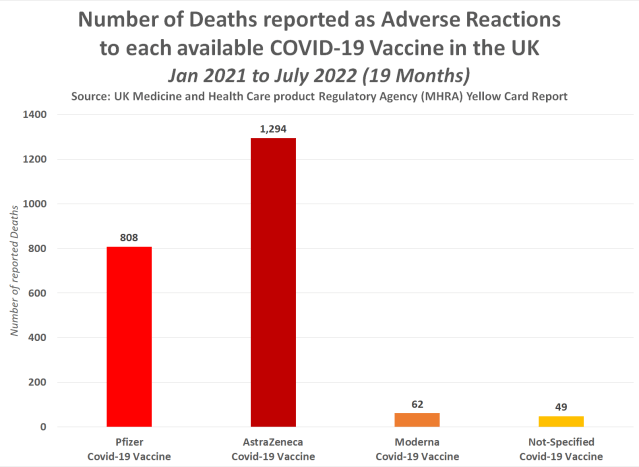
The MHRA also confirmed, separately, in their weekly Yellow Card report summary
that they had received a grand total of 2,213 adverse reactions to the
Covid-19 injections associated with a fatal outcome between January 2021
and July 2022, a period of 19 months –
Meaning, there have officially been 5.5x as many deaths in just 19
months due to the Covid-19 vaccines than there have been due to every
other available vaccine combined since the year 2001.
Twenty years and 8 months is a period that is 13.7 x longer than the
nineteen-month period where the Covid-19 vaccines have been rolled out.
Therefore, the number of deaths reported to all other vaccines
combined in the same time frame of nineteen months equates to 29.5
deaths.
This means the Covid-19 injections are proving to be a shocking 7,402% more deadly than every other vaccine available in the UK.
The number of athletes who have died since the beginning of 2021 has
risen exponentially compared to the yearly number of deaths of athletes
officially recorded between 1966 and 2004.
So much so that the monthly average number of deaths between January
2021 and April 2022 is 1,700% higher than the monthly average between
1966 and 2004, and the current trend for 2022 so far shows this could
increase to 4,120% if the increased number of deaths continues, with the
number of deaths in March 2022 alone 3 times higher than the previous
annual average.
According to a scientific study
conducted by the ‘Division of Pediatric Cardiology, University Hospital
of Lausanne, Lausanne, Switzerland which was published in 2006, between
the years 1966 and 2004 there were 1,101 sudden deaths among athletes
under the age of 35.
Now, thanks to the GoodSciencing.com
team, we have a comprehensive list of athletes who have collapsed
and/or died since January 2021, a month after the first Covid-19
injection was administered to the general public.
Because it is such as long list we are not including it in this article so that full list can be accessed in full here.
The following chart shows the number of recorded athlete collapses
and deaths between January 2021 and April 2022, courtesy of the linked
list above –
As you can see there has undoubtedly been a rise from January 2021
onwards, the question is whether this was ordinary and to be expected.
In all between Jan 21 and April 22 a total number of 673 athletes are
known to have died. This number could, however, be much higher. So
that’s 428 less than the number to have died between 1966 and 2004. The
difference here though is that the 1,101 deaths occurred over 39 years,
whereas 673 recent deaths have occurred over 16 months.
The yearly average number of deaths between 1966 and 2004 equates to
28. January 2022 saw 3 times as many athlete deaths as this previous
annual average, as did March 2022. So this is obviously highly
indicative of a problem.
The 2021 total equates to 394 deaths, 14x higher than the 1966 to
2004 annual average. The Jan to April 2022 total, a period of 4 months,
equates to 279 deaths, 9.96x higher than the annual average between 1966
and 2004.
However, if we divide the 66 to 04 annual average by 3 to make it
equivalent to the 4 months’ worth of deaths so far in 2022, we get 9.3
deaths. So in effect, 2022 so far has seen deaths 10x higher than the
expected rate.
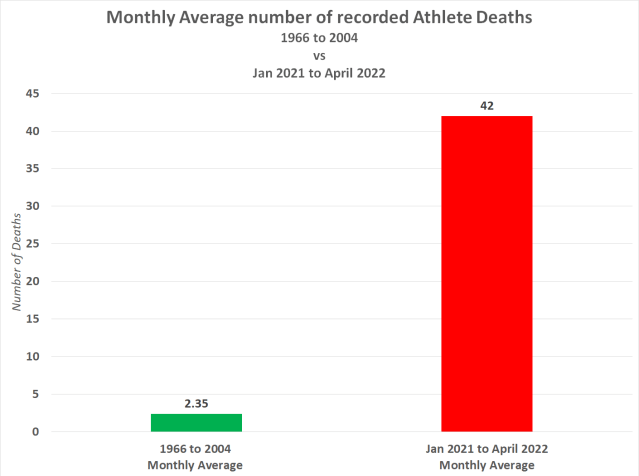
The following chart shows the monthly average number of recorded athlete deaths –
The yearly average number of deaths between 1966 and 2004 equates to
28. January 2022 saw 3 times as many athlete deaths as this previous
annual average, as did March 2022. So this is obviously highly
indicative of a problem.
The 2021 total equates to 394 deaths, 14x higher than the 1966 to
2004 annual average. The Jan to April 2022 total, a period of 4 months,
equates to 279 deaths, 9.96x higher than the annual average between 1966
and 2004.
However, if we divide the 66 to 04 annual average by 3 to make it
equivalent to the 4 months’ worth of deaths so far in 2022, we get 9.3
deaths. So in effect, 2022 so far has seen deaths 10x higher than the
expected rate.
The following chart shows the monthly average number of recorded athlete deaths –
So between 1966 and 2004. the monthly average number of deaths
equates to 2.35. But between January 2021 and April 2022, the monthly
average equates to 42. This is an increase of 1,696%.
There is plenty more evidence out there to prove that the Covid-19
injections are killing hundreds of thousands of people every single
week. For instance, the UK Government has confirmed fully vaccinated
young adults are 92% more likely to die than unvaccinated young adults
(see here).
They’ve also confirmed COVID vaccinated children are at least 4423%
more likely to die of any cause & 13,633% more likely to die of
COVID-19 than unvaccinated children (see here).
But the most damning evidence of all lies in 4 simple facts.
Fact No.1: Medicine Regulators have been forced to admit the Covid-19 vaccine can damage the heart.
Fact No.2: Record-breaking numbers of people are requesting an ambulance due to conditions affecting the heart.
Fact No.3: Hundreds of thousands of excess deaths are being recorded
around the world on a weekly basis, but only a small minority can be
attributed to Covid-19.
Fact No.4: Age-standardised mortality rates are lowest among the unvaccinated population in every single age group.
These are not baseless claims. They are official Government statistics and they are found in official Government reports.
Therefore, official Government reports prove without a shadow of a
doubt that hundreds of thousands of people are dying every single week
due to Covid-19 vaccination.


